

Survival of very preterm infants admitted to neonatal care in England 2008-2014: time trends and regional variation
- PMID: 28883097
- PMCID: PMC5916099
- DOI: 10.1136/archdischild-2017-312748
Survival of very preterm infants admitted to neonatal care in England 2008-2014: time trends and regional variation
Abstract
Objective: To analyse survival trends and regional variation for very preterm infants admitted to neonatal care.
Setting: All neonatal units in England.
Patients: Infants born at 22+0-31+6 weeks+daysgestational age (GA) over 2008-2014 and admitted to neonatal care; published data for admitted infants 22+0-25+6 weeks+days GA in 1995 and 2006, and for live births at 22+0-31+6 weeks+days GA in 2013.
Methods: We obtained data from the National Neonatal Research Database. We used logistic regression to model survival probability with birth weight, GA, sex, antenatal steroid exposure and multiple birth included in the risk adjustment model and calculated annualpercentage change (APC) for trends using joinpoint regression. We evaluated survival over a 20-year period for infants <26 weeks' GA using additional published data from the EPICure studies.
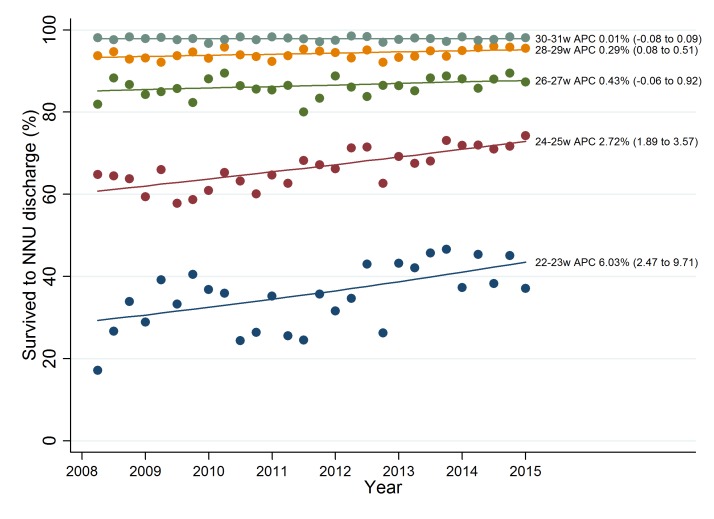
Results: We identified 50 112 eligible infants. There was an increase in survival over 2008-2014 (2008: 88.0%; 2014: 91.3%; adjusted APC 0.46% (95% CI 0.30 to 0.62) p<0.001). The greatest improvement was at 22+0-23+6 weeks (APC 6.03% (95% CI 2.47 to 3.53) p=0.002). Improvement largely occurred in London and South of England (APC: London 1.26% (95% CI 0.60 to 1.96); South of England 1.09% (95% CI 0.36 to 1.82); Midlands and East of England 0.15% (95% CI -0.56 to 0.86); and North of England 0.26% (95% CI -0.54 to 1.07)). Survival at the earliest gestations improved at a similar rate over 1995-2014 (22+0-25+6 weeks, APC 2.73% (95% CI 2.35 to 3.12), p value for change=0.25).
Conclusions: Continued national improvement in the survival of very preterm admissions masks important regional variation. Timely assessment of preterm survival is feasible using electronic records.
Keywords: data collection; epidemiology; health services research; neonatology.
© Article author(s) (or their employer(s) unless otherwise stated in the text of the article) 2018. All rights reserved. No commercial use is permitted unless otherwise expressly granted.
Figures

References
-
- Lawn JE, Cousens S. Zupan J for the Lancet Neonatal Survival Steering Team. 4 million neonatal deaths: when? where? why? Lancet 2005;365:891–900. - PubMed
-
- Department for Communities and Local Government. The English Indices of Deprivation 2010, Technical report, Department of Communities and Local Governement. London, 2011. https://www.gov.uk/government/statistics/english-indices-of-deprivation-....
MeSH terms
Grants and funding
LinkOut - more resources
Full Text Sources
Other Literature Sources
Medical