. 2017 Sep 7;8(1):474.
doi: 10.1038/s41467-017-00203-5.

A thiol probe for measuring unfolded protein load and proteostasis in cells

Affiliations

A thiol probe for measuring unfolded protein load and proteostasis in cells

Moore Z Chen et al. Nat Commun. .

Abstract

When proteostasis becomes unbalanced, unfolded proteins can accumulate and aggregate. Here we report that the dye, tetraphenylethene maleimide (TPE-MI) can be used to measure cellular unfolded protein load. TPE-MI fluorescence is activated upon labelling free cysteine thiols, normally buried in the core of globular proteins that are exposed upon unfolding. Crucially TPE-MI does not become fluorescent when conjugated to soluble glutathione. We find that TPE-MI fluorescence is enhanced upon reaction with cellular proteomes under conditions promoting accumulation of unfolded proteins. TPE-MI reactivity can be used to track which proteins expose more cysteine residues under stress through proteomic analysis. We show that TPE-MI can report imbalances in proteostasis in induced pluripotent stem cell models of Huntington disease, as well as cells transfected with mutant Huntington exon 1 before the formation of visible aggregates. TPE-MI also detects protein damage following dihydroartemisinin treatment of the malaria parasites Plasmodium falciparum. TPE-MI therefore holds promise as a tool to probe proteostasis mechanisms in disease.Proteostasis is maintained through a number of molecular mechanisms, some of which function to protect the folded state of proteins. Here the authors demonstrate the use of TPE-MI in a fluorigenic dye assay for the quantitation of unfolded proteins that can be used to assess proteostasis on a cellular or proteome scale.


Conflict of interest statement

The authors declare no competing financial interests.

Figures

Fig. 1
Fig. 1
Strategy for assaying protein foldedness via access to buried cysteine thiols. a Strategy for probing free cysteine thiols that become exposed to the solvent upon protein unfolding and permissive to maleimide reaction. b Structure of tetraphenylethene (TPE) conjugated to a maleimide (MI). Fluorescence is enabled upon conjugation to a protein and immobilisation of the phenyl rotamers.
Fig. 2
Fig. 2
TPE-MI preferentially reacts with buried cysteine thiols in unfolded proteins and switches on fluorescence. Shown are representative reaction kinetics for four proteins (note that the absolute fluorescence values between graphs here and in other figures cannot be compared to each other due to differences in instrument settings). a Bovine β-lactoglobulin, which contains five thiols: one buried free thiol and four disulphide-linked thiols; and bovine ubiquitin, which contains no thiols. b Saccharomyces cerevisiae enolase, which contains one buried free thiol and c human peroxiredoxin 3, which contains three thiols: one buried free thiol and two disulphide-linked surface-exposed thiols. Proteins were suspended in 100 mM sodium phosphate, pH 7.4, alone or supplemented with guandine hydrochloride (GuHCl) to induce denaturation. At the start of the reaction 50 μM TPE-MI was added. d Same design but with 50 μM N-methylmaleimide (NMM) added before the addition of TPE-MI.
Fig. 3
Fig. 3
TPE-MI fluorescence is not activated by glutathione reaction and can detect increases in unfolded protein load in cell lysates. a Reactivity of TPE-MI (50 μM) with β-lactoglobulin (250 μM) in the presence of the small thiol containing peptide glutathione (0.025 mM–8 mM GSH) and 4.6 M GuHCl. Fluorescence intensity of TPE-MI with different concentrations of GSH is shown for comparison (measured in 4.6 M GuHCl). Arrow indicates 7:3 protein thiol to glutathione thiol ratio found intracellularly. b Reaction kinetics of 50 µM TPE-MI in the presence of intact and unfolded cell lysates from mouse Neuro2a neuroblastoma cells (0.5 mg ml−1 total cellular protein). Shown are ‘native’ cell lysate in 100 mM sodium phosphate, pH 7.4 and ‘unfolded’ cell lysate containing 4.6 M GuHCl.
Fig. 4
Fig. 4
TPE-MI fluorescence increases in accordance with diverse proteome stresses. a Confocal microscopy images for TPE-MI staining of HeLa cells with ER Tracker counterstain. Cells were fixed in 4% (v/v) paraformaldehyde for 15 min after staining with 50 µM TPE-MI. Scale bar, 20 μm. b Unfolding of the proteome by heat shock as assessed by denaturation of Renilla luciferase and luciferase activity. Data show luciferase luminescence of lysates taken after heat shock at 42 °C of HeLa cells transfected with Renilla luciferase for the times shown, n = 5; mean ± s.e.m. c Heat shock treatment of HeLa cells at 42 °C for 45 min and subsequent time course of recovery at 37 °C. Data show median TPE-MI fluorescence measured by flow cytometry of cells stained at the indicated time points, n = 5 technical replicates; mean ± s.e.m. Statistics for b, c were calculated between test groups and basal groups or zero time point. The details of the statistics are provided in Supplementary Data 1 where P < 0.05 (indicated by *). d Effect of overnight tunicamycin treatment on HeLa cells. Data show median fluorescence intensity of TPE-MI stained cells measured by flow cytometry, n = 5 biological replicates; mean ± s.e.m. e Effects of hsp90 inhibitor novobiocin (800 µM for 6 h) and free radical generator, hydrogen peroxide (100 µM for 1 h) on HEK293 cells. Data show means ± s.d. for five replicates. ***P < 0.0001. See Supplementary Data 1 for full statistics.
Fig. 5
Fig. 5
Detection of proteome-wide Cys-reactivity upon tunicamycin treatment. a In-gel fluorescence of TPE-MI stained Neuro2a cell lysates by SDS–PAGE. Cells were treated with tunicamycin (1 µg ml−1, overnight) or vehicle control, then labelled with 50 µM TPE-MI for 30 min before lysis. 40 µg total cellular protein was loaded on the gel. Graphs show quantitation of fluorescence intensities in each lane (n = 5 biological replicates; mean ± s.e.m.; *, P < 0.05—see Supplementary Data 1 for full statistics). b Corresponding Coomassie stained gel of a, and quantification. Graph shows quantitation of the Commassie intensities (n = 5; mean ± s.e.m.; see Supplementary Data 1 for full statistics).
Fig. 6
Fig. 6
Tunicamycin-mediated block of folding selectively alters cysteine reactivity to TPE-MI. Data relates to Neuro-2a cells treated with TPE-MI (30 min; 200 µM) after overnight tunicamycin pre-treatment (1 µM) versus an untreated control. a Histogram of the peptide abundance ratios between tunicamycin-treated cells and control cells differentially labelled using SILAC. ***P < 0.0001 between two groups assessed by Wilcoxon matched-pairs signed rank test. See Supplementary Data 1 for full statistics. Differences indicate a tunicamycin-mediated loss of Cys residue-containing peptides attributable to increased TPE reaction. b Plot of peptide abundances (calculated from non-Cys peptide ratios) versus change of Cys reactivity (ratios of Cys peptides normalised to abundance by the non-cys peptides within the same protein) attributable to tunicamycin treatment. Shown are only peptides that display significant changes in Cys reactivity due to tunicamycin treatment (P < 0.05 measured by Student’s t-test; details in Supplementary Data 2 and Supplementary Fig. 9). c Case study of peptides derived from ACTG. Shown are the mean ± s.d. peptide abundance ratios of five replicates (left) versus where the peptides map on the sequence of ACTG (right). Colours on bar graph are coordinated to the sequence map and cysteine residues are shown in red on the sequence.
Fig. 7
Fig. 7
Backlog of unfolded protein in Neuro-2a cells triggered by mutant Huntingtin protein. a Impact of Htt exon 1 (Httex1) expression on TPE-MI fluorescence comparing the wild-type polyQ length (25Q) with a severe mutant (97Q) as fusions to mCherry. Cells were transfected and analysed by flow cytometry with the data binned into different expression levels based on mCherry fluorescence. Data show n = 3 technical replicates; mean ± s.e.m. *represents significant differences between 25QHttex1 and 97QHttex1 (P < 0.05). b Reanalysis of the data in panel a by PulSA to separate the cells with visible Httex1 inclusions from those without. Data show n = 3 technical replicates; mean ± s.e.m. *represents significant differences between 97QHttex1 inclusion and 97QHttex1 non-inclusion populations. c TPE reports on stress in primitive neural stem cells derived from induced pluripotent stem cells from Huntington patients. Shown are Huntington diease human neural cell lines encoding variable polyQ lengths in the Huntingtin gene. The gene corrected lines were gene-edited by CRISPR-Cas9 technology. Cells were analysed by flow cytometry and show fold change in ER stress induced by 1 µM thapsigargin relative to vehicle (dimethyl sulfoxide). Data represent n = 3 technical replicates, mean ± s.e.m. *represents significant differences. The details of the statistics in this figure are provided in Supplementary Data 1.
Fig. 8
Fig. 8
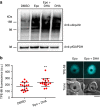
TPE reports on accumulation of unfolded proteins in malaria parasites (P. falciparum) treated with dihydroartemisinin (DHA) and epoxomicin. a Western blot of trophozoite stage P. falciparum treated with DHA and the proteasome inhibitor, epoxomicin (Epo) or DMSO control, for 3 h. b TPE-MI fluorescence values from individual trophozoites within red blood cells, measured by confocal microscopy. (left) Bars represent the mean ± s.d. *represents a significant difference. The details of the statistics in this figure are provided in Supplementary Data 1. (right) A representative set of images. Scale bar, 3 µm.

References

    1. Gershenson A, Gierasch LM, Pastore A, Radford SE. Energy landscapes of functional proteins are inherently risky. Nat. Chem. Biol. 2014;10:884–891. doi: 10.1038/nchembio.1670. - DOI - PMC - PubMed
    1. Anfinsen CB. Principles that govern the folding of protein chains. Science. 1973;181:223–230. doi: 10.1126/science.181.4096.223. - DOI - PubMed
    1. Braselmann E, Chaney JL, Clark PL. Folding the proteome. Trends Biochem. Sci. 2013;38:337–344. doi: 10.1016/j.tibs.2013.05.001. - DOI - PMC - PubMed
    1. Hutt DM, Balch WE. Expanding proteostasis by membrane trafficking networks. Cold Spring Harb. Perspect. Biol. 1973;5:a013383. - PMC - PubMed
    1. Roth DM, Balch WE. Modeling general proteostasis: proteome balance in health and disease. Curr. Opin. Cell Biol. 2011;23:126–134. doi: 10.1016/j.ceb.2010.11.001. - DOI - PMC - PubMed

Publication types

MeSH terms