

Genome-wide identification and co-expression network analysis provide insights into the roles of auxin response factor gene family in chickpea
- PMID: 28883480
- PMCID: PMC5589731
- DOI: 10.1038/s41598-017-11327-5
Genome-wide identification and co-expression network analysis provide insights into the roles of auxin response factor gene family in chickpea
Abstract
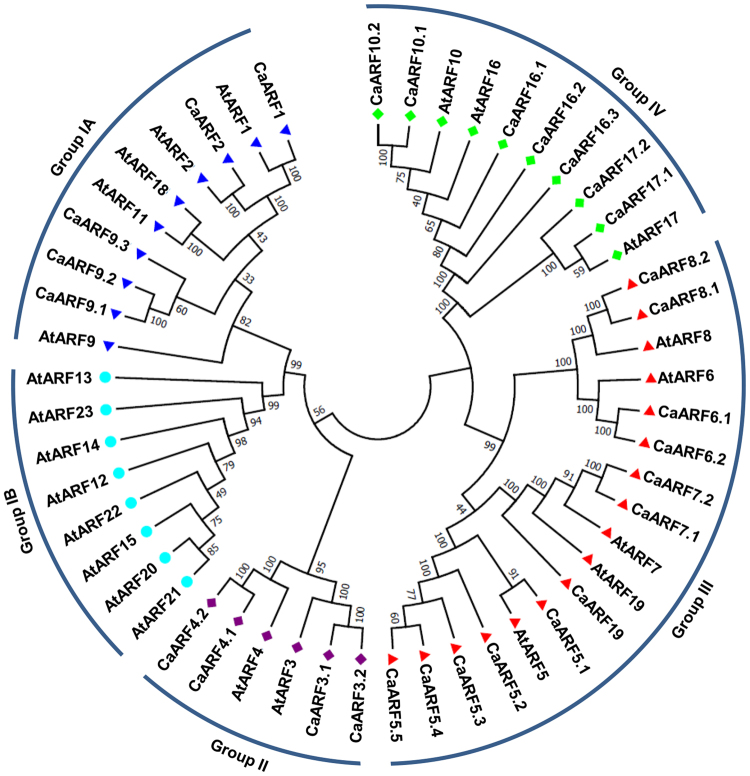
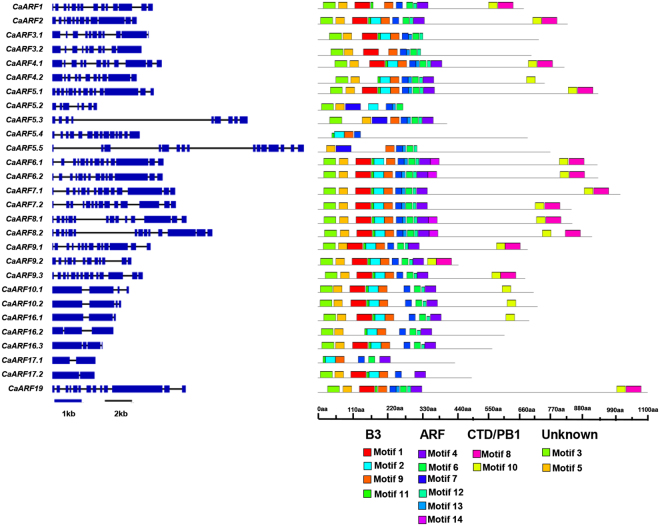
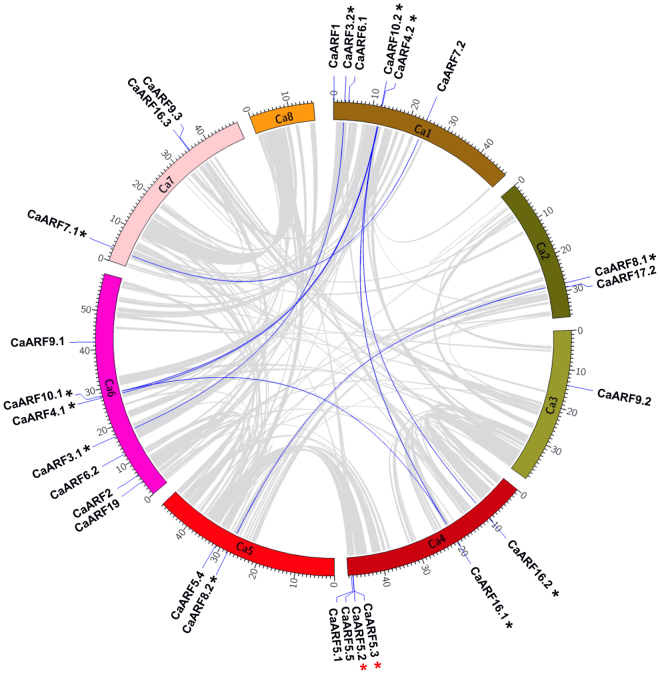
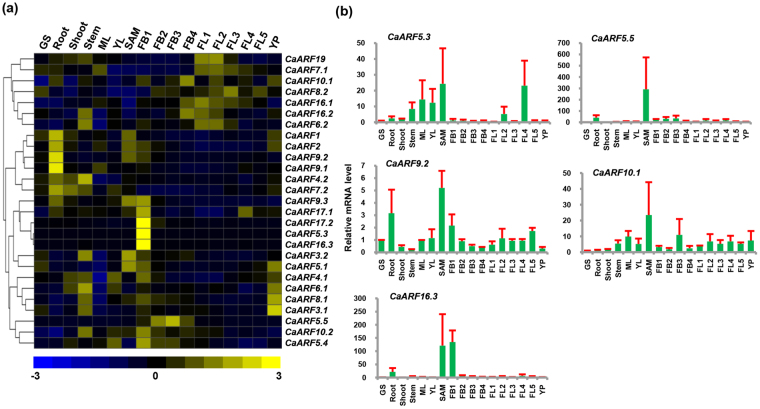
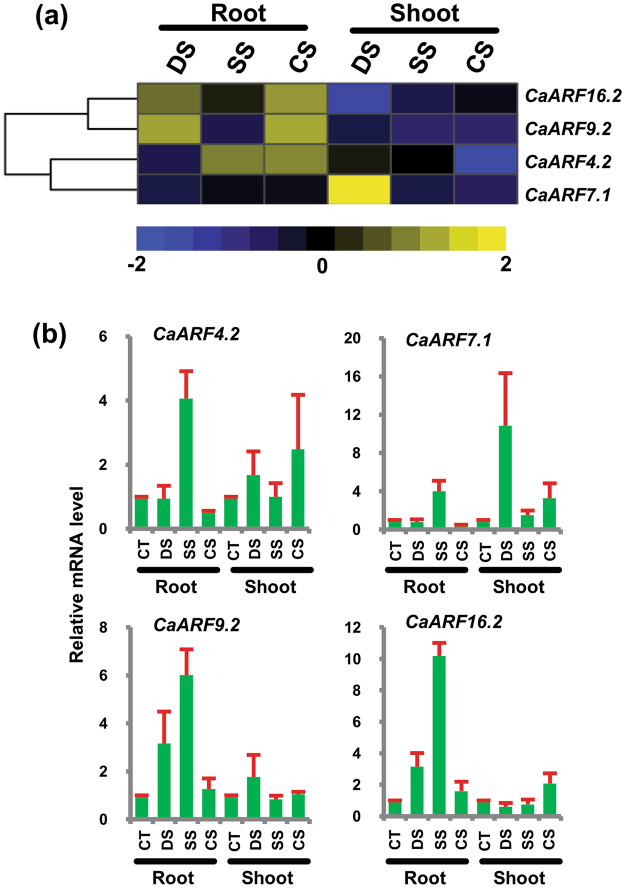
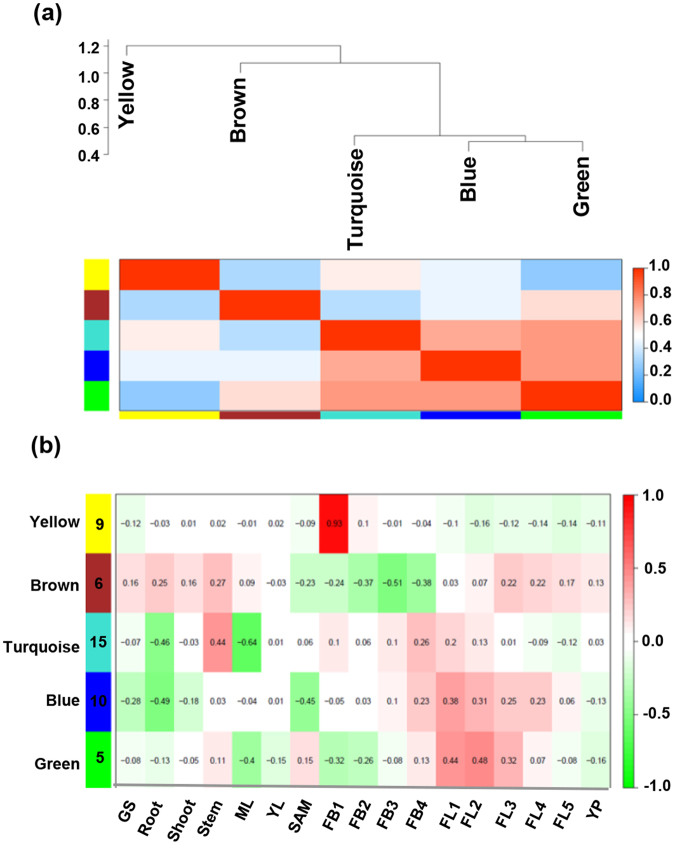
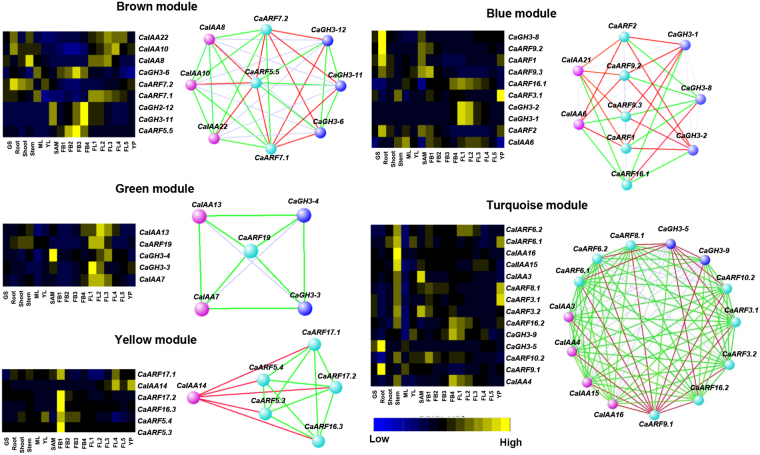
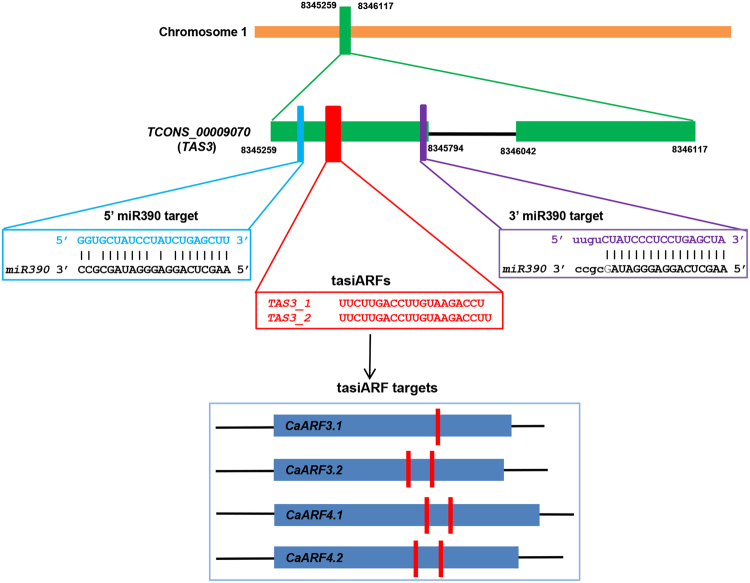
Auxin response factors (ARFs) are the transcription factors that regulate auxin responses in various aspects of plant growth and development. Although genome-wide analysis of ARF gene family has been done in some species, no information is available regarding ARF genes in chickpea. In this study, we identified 28 ARF genes (CaARF) in the chickpea genome. Phylogenetic analysis revealed that CaARFs can be divided into four different groups. Duplication analysis revealed that 50% of CaARF genes arose from duplication events. We analyzed expression pattern of CaARFs in various developmental stages. CaARF16.3, CaARF17.1 and CaARF17.2 showed highest expression at initial stages of flower bud development, while CaARF6.2 had higher expression at later stages of flower development. Further, CaARF4.2, CaARF9.2, CaARF16.2 and CaARF7.1 exhibited differential expression under different abiotic stress conditions, suggesting their role in abiotic stress responses. Co-expression network analysis among CaARF, CaIAA and CaGH3 genes enabled us to recognize components involved in the regulatory network associated with CaARFs. Further, we identified microRNAs that target CaARFs and TAS3 locus that trigger production of trans-acting siRNAs targeting CaARFs. The analyses presented here provide comprehensive information on ARF family members and will help in elucidating their exact function in chickpea.
Conflict of interest statement
The authors declare that they have no competing interests.
Figures
Similar articles
-
Genome-wide identification of the auxin response factor gene family in Cicer arietinum.BMC Genomics. 2018 Apr 27;19(1):301. doi: 10.1186/s12864-018-4695-9. BMC Genomics. 2018. PMID: 29703137 Free PMC article.
-
Genome-wide identification, molecular evolution, and expression analysis of auxin response factor (ARF) gene family in Brachypodium distachyon L.BMC Plant Biol. 2018 Dec 6;18(1):336. doi: 10.1186/s12870-018-1559-z. BMC Plant Biol. 2018. PMID: 30522432 Free PMC article.
-
Identification and Expression Profiling of the Auxin Response Factors in Capsicum annuum L. under Abiotic Stress and Hormone Treatments.Int J Mol Sci. 2017 Dec 15;18(12):2719. doi: 10.3390/ijms18122719. Int J Mol Sci. 2017. PMID: 29244768 Free PMC article.
-
Auxin response factors.Curr Opin Plant Biol. 2007 Oct;10(5):453-60. doi: 10.1016/j.pbi.2007.08.014. Epub 2007 Sep 27. Curr Opin Plant Biol. 2007. PMID: 17900969 Review.
-
AUXIN RESPONSE FACTOR protein accumulation and function.Bioessays. 2023 Nov;45(11):e2300018. doi: 10.1002/bies.202300018. Epub 2023 Aug 16. Bioessays. 2023. PMID: 37584215 Free PMC article. Review.
Cited by
-
Co-expression and Transcriptome Analysis of Marchantia polymorpha Transcription Factors Supports Class C ARFs as Independent Actors of an Ancient Auxin Regulatory Module.Front Plant Sci. 2018 Oct 1;9:1345. doi: 10.3389/fpls.2018.01345. eCollection 2018. Front Plant Sci. 2018. PMID: 30327658 Free PMC article.
-
Genome-wide identification, in silico characterization and expression analysis of the RNA helicase gene family in chickpea (C. arietinum L.).Sci Rep. 2022 Jun 13;12(1):9778. doi: 10.1038/s41598-022-13823-9. Sci Rep. 2022. PMID: 35697711 Free PMC article.
-
The Knockdown of AUXIN RESPONSE FACTOR 2 Confers Enhanced Tolerance to Salt and Drought Stresses in Tomato (Solanum lycopersicum L.).Plants (Basel). 2023 Jul 28;12(15):2804. doi: 10.3390/plants12152804. Plants (Basel). 2023. PMID: 37570958 Free PMC article.
-
Auxin Response Factor 2A Is Part of the Regulatory Network Mediating Fruit Ripening Through Auxin-Ethylene Crosstalk in Durian.Front Plant Sci. 2020 Sep 9;11:543747. doi: 10.3389/fpls.2020.543747. eCollection 2020. Front Plant Sci. 2020. PMID: 33013965 Free PMC article.
-
Dynamic Transcriptome Changes Related to Oil Accumulation in Developing Soybean Seeds.Int J Mol Sci. 2019 May 5;20(9):2202. doi: 10.3390/ijms20092202. Int J Mol Sci. 2019. PMID: 31060266 Free PMC article.
References
Publication types
MeSH terms
Substances
LinkOut - more resources
Full Text Sources
Other Literature Sources
