. 2017 Aug 24:11:478.
doi: 10.3389/fnins.2017.00478. eCollection 2017.

Investigations into Hypoxia and Oxidative Stress at the Optic Nerve Head in a Rat Model of Glaucoma

Affiliations

Investigations into Hypoxia and Oxidative Stress at the Optic Nerve Head in a Rat Model of Glaucoma

Glyn Chidlow et al. Front Neurosci. .

Abstract

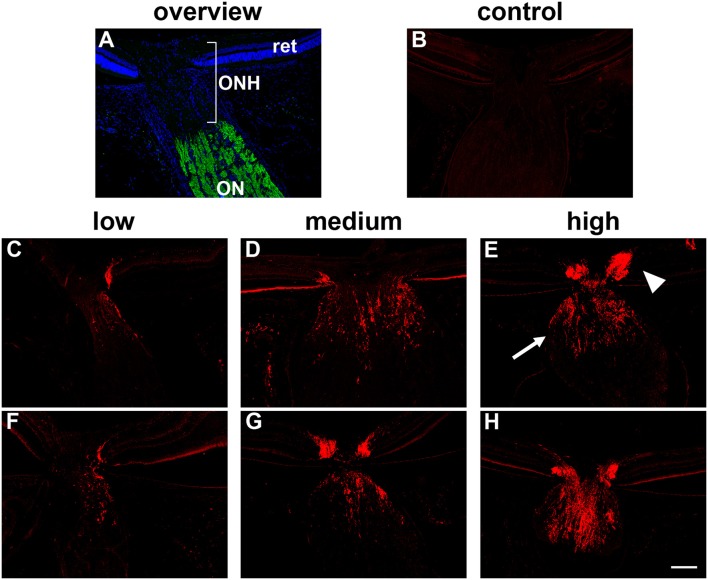
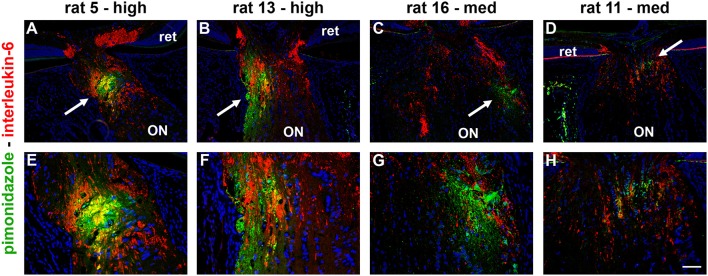
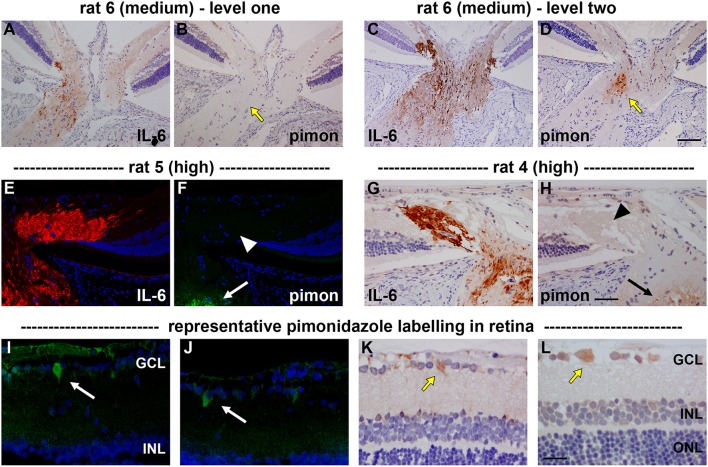
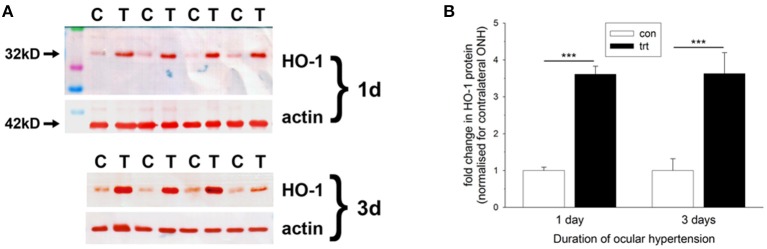
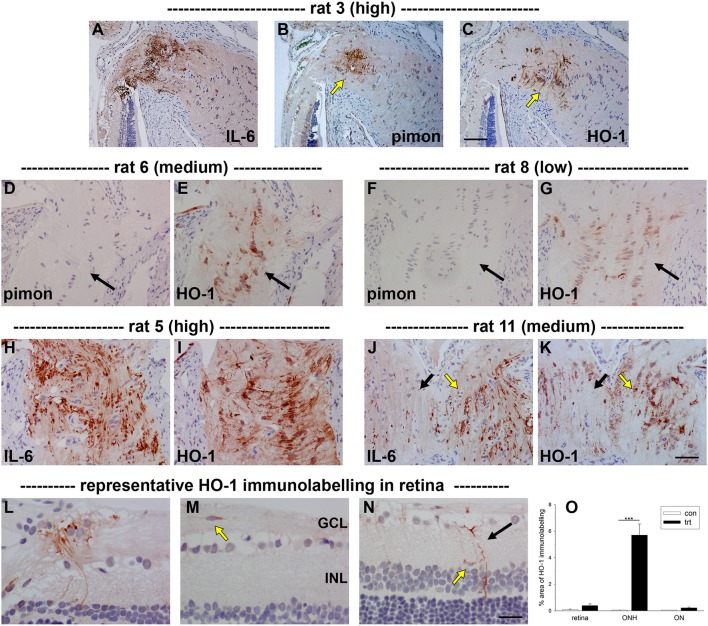
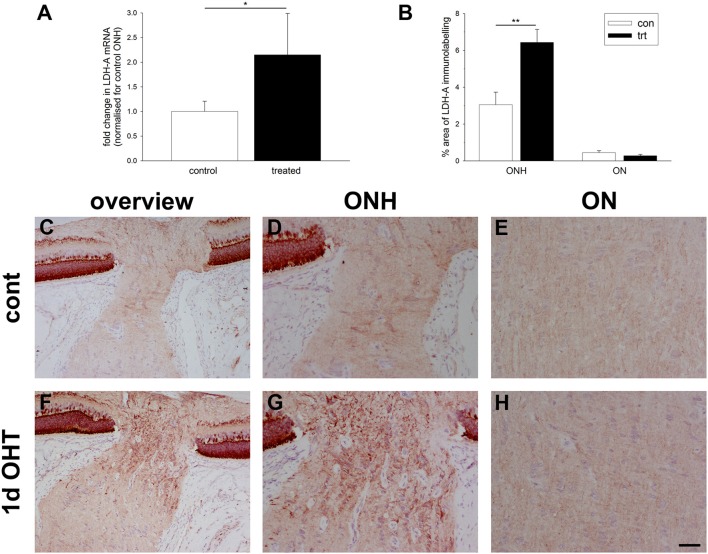
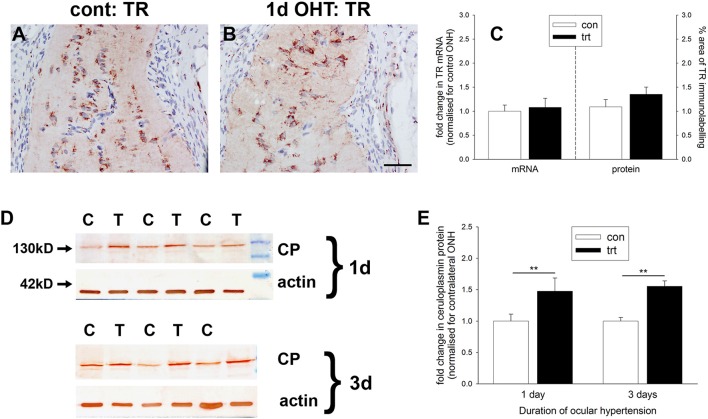
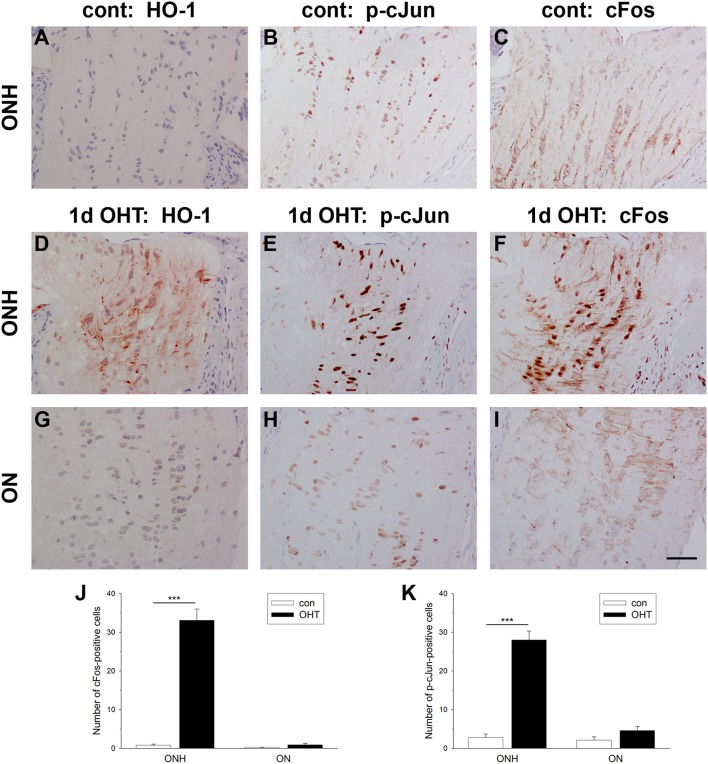
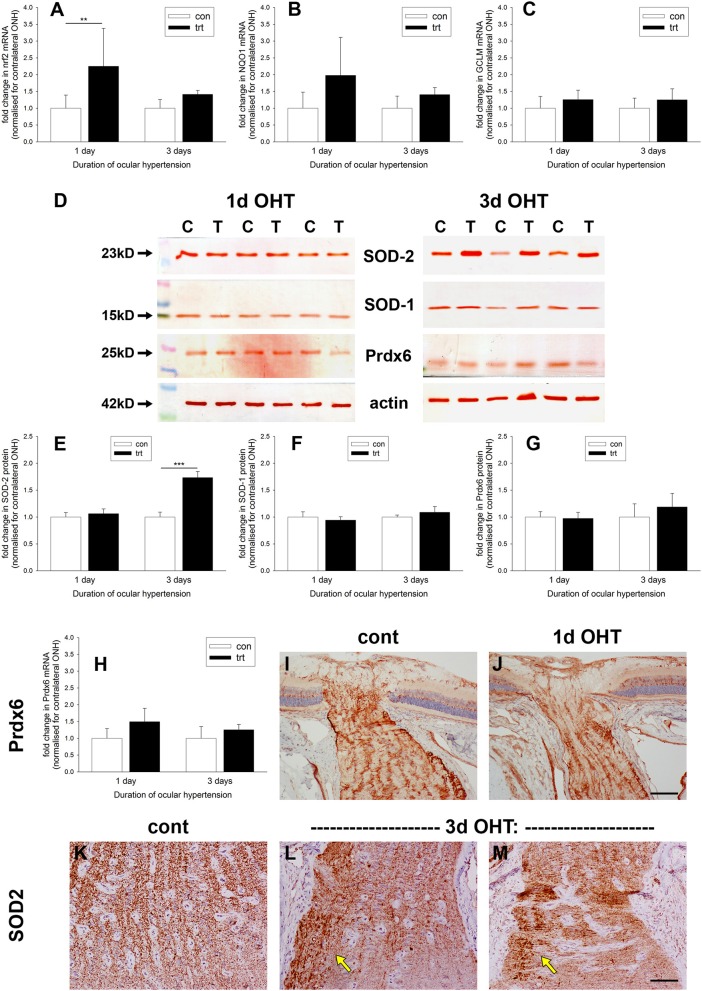
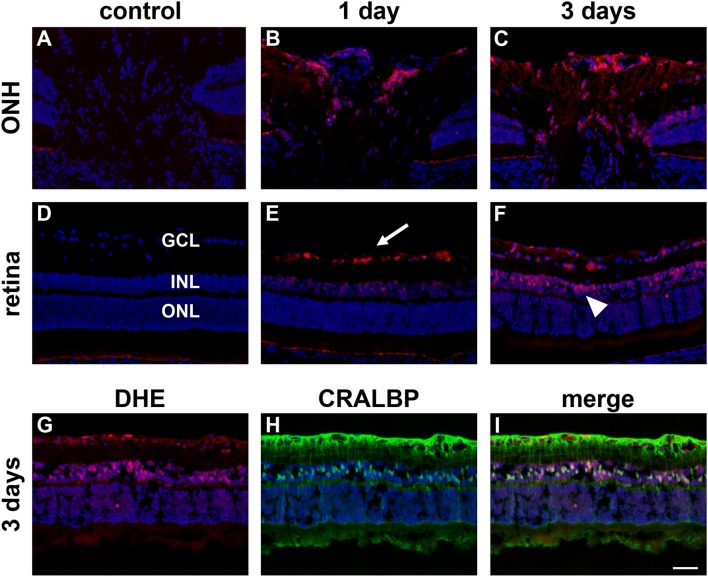
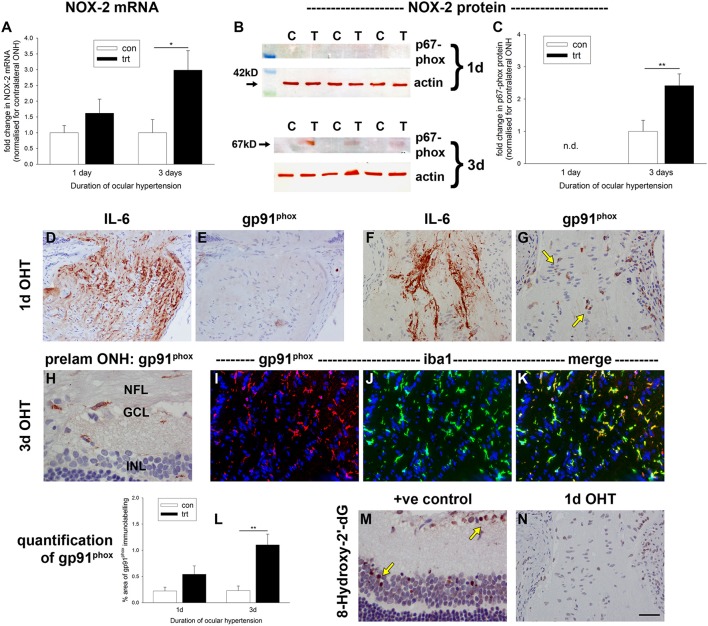
The vascular hypothesis of glaucoma proposes that retinal ganglion cell axons traversing the optic nerve head (ONH) undergo oxygen and nutrient insufficiency as a result of compromised local blood flow, ultimately leading to their degeneration. To date, evidence for the hypothesis is largely circumstantial. Herein, we made use of an induced rat model of glaucoma that features reproducible and widespread axonal transport disruption at the ONH following chronic elevation of intraocular pressure. If vascular insufficiency plays a role in the observed axonal transport failure, there should exist a physical signature at this time point. Using a range of immunohistochemical and molecular tools, we looked for cellular events indicative of vascular insufficiency, including the presence of hypoxia, upregulation of hypoxia-inducible, or antioxidant-response genes, alterations to antioxidant enzymes, increased formation of superoxide, and the presence of oxidative stress. Our data show that ocular hypertension caused selective hypoxia within the laminar ONH in 11/13 eyes graded as either medium or high for axonal transport disruption. Hypoxia was always present in areas featuring injured axons, and, the greater the abundance of axonal transport disruption, the greater the likelihood of a larger hypoxic region. Nevertheless, hypoxic regions were typically focal and were not necessarily evident in sections taken deeper within the same ONH, while disrupted axonal transport was frequently encountered without any discernible hypoxia. Ocular hypertension caused upregulation of heme oxygenase-1-an hypoxia-inducible and redox-sensitive enzyme-in ONH astrocytes. The distribution and abundance of heme oxygenase-1 closely matched that of axonal transport disruption, and encompassed hypoxic regions and their immediate penumbra. Ocular hypertension also caused upregulations in the iron-regulating protein ceruloplasmin, the anaerobic glycolytic enzyme lactate dehydrogenase, and the transcription factors cFos and p-cJun. Moreover, ocular hypertension increased the generation of superoxide radicals in the retina and ONH, as well as upregulating the active subunit of the superoxide-generating enzyme NADPH oxidase, and invoking modest alterations to antioxidant-response enzymes. The results of this study provide further indirect support for the hypothesis that reduced blood flow to the ONH contributes to axonal injury in glaucoma.

Keywords: astrocyte; axonal transport; glaucoma; hypoxia; optic nerve head; oxidative stress; retinal ganglion cell.


Figures

Figure 1
Figure 1
Inter-animal variability in axonal transport disruption at the optic nerve head (ONH) 24 h after induction of ocular hypertension. (A) Overview of the anatomy of the rat ONH, as labeled with the nuclear dye DAPI. The location at which RGC axons become myelinated is demarcated by myelin basic protein (green). (B) In normal rats, minimal interleukin-6 is associated with RGC axons. (C–H) At 24 h after induction of chronic ocular hypertension, accumulation of interleukin-6 is evident within axons in the prelaminar (arrowhead) and laminar (arrow) ONH. The abundance of axonal transport disruption varies markedly between animals, ranging from a few to numerous immunopositive fibers, which can be classified, using a simple scoring system, as low, medium, or high; two examples are shown for each category. ON, optic nerve; ret, retina. Scale bar: 100 μm.
Figure 2
Figure 2
Localization of hypoxia within the optic nerve head (ONH) at 24 h following induction of ocular hypertension. (A–H) Double labeling immunofluorescence of interleukin-6 (red), to demarcate those axons with disrupted axonal transport, with pimonidazole (green), to highlight hypoxic regions (arrows), in four representative animals. (A–D) are low magnification images, while (E–H) show the same sections at higher magnification. In the examples presented, the rats with high axonal transport disruption feature larger hypoxic regions than the rats with medium axonal transport disruption. The position of the hypoxic region can be seen to vary markedly between animals. ON, optic nerve; ret, retina. Scale bars: (A–D) = 100 μm; (E–H) = 50 μm.
Figure 3
Figure 3
Localization of hypoxia within the optic nerve head (ONH) and retina at 24 h following induction of ocular hypertension. (A–D) Hypoxic regions can be very focal, as shown by two images of pimonidazole (pimon) staining in the same rat ONH (B,D), each with an accompanying image of interleukin-6 (IL-6) to demarcate the number of axons with disrupted axonal transport (A,C): hypoxia is not detectable in (B, yellow arrow), but a small hypoxic region is apparent in (D; yellow arrow). It is notable that positive staining for pimonidazole is only observed in the portion of the ONH that displays greater axonal transport disruption (C vs. A). (E–H) Pimonidazole staining is not evident in the prelaminar ONH (F,H, white and black arrowheads), even in animals with prominent axonal transport disruption at this location (E,G) and featuring hypoxic regions within the laminar ONH (F,H, white and black arrows). (I–L) In the retina, very few cells stain positively for pimonidazole. In animals with high axonal transport disruption, occassional cells in the GCL are observed (white and yellow arrows). GCL, ganglion cell layer; INL, inner nuclear layer; ONL, outer nuclear layer. Scale bars: (A–D) = 100 μm; (E–H) = 50 μm; (I–L) = 25 μm.
Figure 4
Figure 4
Evaluation of heme oxygenase-1 (HO-1) expression in optic nerve head (ONH) extracts at 1 and 3 d after induction of ocular hypertension, as determined by Western immunoblotting. (A) Representative immunoblots from four animals at each time point are shown (C, control ONH; T, treated ONH). Single bands of the expected molecular weight are apparent. β-actin immunoblots for the same samples are also shown, as gel-loading controls. (B) Quantification of HO-1 protein data. Values (represented as mean ± SEM, where n = 12–14) are normalized for actin and expressed relative to controls. ***P < 0.001, by Student's unpaired t-test.
Figure 5
Figure 5
Localization of heme oxygenase-1 (HO-1) immunolabeling within the optic nerve head (ONH) and retina at 24 h following induction of ocular hypertension. (A–C) Images of axonal transport disruption as delineated by interleukin-6 (IL-6), pimonidazole (pimon) staining to demarcate any hypoxia, and HO-1, all within the same plane of the ONH of rat 3. It can be seen that the distribution of HO-1 overlaps closely with those of axonal injury and hypoxia, but is somewhat more extensive than the latter (arrows). (D–G) Of note, HO-1 is upregulated by ONH glial cells in ocular hypertensive rats that do not feature an overt hypoxic region. (H–K) HO-1 is upregulated more robustly in rats that feature abundant axonal transport disruption. The distribution of HO-1 immunolabeling closely parallels that of IL-6 (see J,K: black arrows, low IL-6/HO-1 expression; yellow arrows, high IL-6/HO-1 expression). (L–N) In the retina, HO-1 immunolabeling is sparse at 24 h. Macroglial cells in the prelaminar ONH are often HO-1-positive (L). HO-1-labeled microglia located within the nerve fiber layer can sometimes also be observed (M). In the mid-central retina, Müller cell processes (black arrow) and microglia present within the inner plexiform layer (yellow arrow) occassionally express HO-1 (N). GCL, ganglion cell layer; INL, inner nuclear layer. Scale bars: (A–C) = 100 μm; (D–K) = 50 μm; (H–J) = 25 μm. (O) Quantification of HO-1 immunolabeling in the retina, optic nerve head (ONH) and myelinated optic nerve (ON). Values represent mean ± SEM, where n = 24. ***P < 0.001, by Student's unpaired t-test.
Figure 6
Figure 6
Evaluation of lactate dehydrogenase-A (LDH-A) expression in the optic nerve head (ONH) at 1 d after induction of ocular hypertension. (A) Level of LDH-A mRNA in ONH samples from OHT eyes, as measured by qPCR. Data are normalized for rhodopsin and expressed relative to controls. Values represent mean ± SEM, where n = 14. *P < 0.05, by Student's unpaired t-test. (B) Quantification of LDH-A immunolabeling in the ONH and myelinated optic nerve (ON). Values represent mean ± SEM, where n = 14. **P < 0.01, by Student's unpaired t-test. (C–H) Representative images of LDH-A immunolabeling within the ONH and proximal portion of the myelinated optic nerve (ON) of a control eye and an eye analyzed at 24 h after induction of ocular hypertension. (C,F) are low magnification images, while (D,E,G,H) show the same sections at higher magnification. In control rats, LDH-A is weakly expressed throughout retinal ganglion cell axons and by glial cells of the ONH. In treated animals, LDH-A expression is markedly upregulated within the ONH, but not ON. Scale bar: (C,F) = 100 μm; (D,E,G,H) = 50 μm.
Figure 7
Figure 7
Evaluation of iron-regulating proteins transferrin receptor and ceruloplasmin in the optic nerve head (ONH) at 1 and 3 d after induction of ocular hypertension (A,B) Representative images of transferrin receptor (TR) immunolabeling within the ONH of a control eye and an eye analyzed at 24 h after induction of ocular hypertension. Scale bar: 50 μm. (C) Quantification of transferrin receptor mRNA expression in ONH extracts, as measured by qPCR, and transferrin receptor protein expression in tissue sections of the ONH. All values represent mean ± SEM, where n = 14. pPCR data are normalized for rhodopsin and expressed relative to controls. (D) Representative immunoblots from three animals at each time point are shown (C, control ONH; T, treated ONH). Single bands of the expected molecular weight are apparent. β-actin immunoblots for the same samples are also shown, as gel-loading controls. (E) Quantification of ceruloplasmin protein data. Values (represented as mean ± SEM, where n = 12–14) are normalized for actin and expressed relative to controls. **P < 0.01, by Student's unpaired t-test.
Figure 8
Figure 8
Evaluation of cFos and p-cJun expression in the optic nerve head (ONH) at 1 d after induction of ocular hypertension (OHT). (A–C) Representative images of heme oxygenase-1 (HO-1), cFos, and p-cJun immunolabeling within a control ONH. (D–I) Representative images of HO-1, cFos, and p-cJun immunolabeling within the ONH and proximal portion of the optic nerve (ON) of a rat analyzed at 24 h after induction of ocular hypertension. In the control ONH, few cell nuclei label positively for cFos or p-cJun. In contrast, at 24 h after induction of OHT, numerous nuclei within the ONH, but not the ON, are cFos- and p-cJun-positive. Heme oxygenase-1 (HO-1) immunolabeling from the same rat is shown for comparative purposes. Scale bar: 50 μm. (J,K) Quantification of cFos and p-cJun immunolabeling in the ONH and ON. Values represent mean ± SEM, where n = 24. ***P < 0.001, by Student's unpaired t-test.
Figure 9
Figure 9
Evaluation of antioxidant defenses in the optic nerve head (ONH) after induction of ocular hypertension (OHT). (A–C) Quantification of mRNAs encoding the antioxidant response element genes Nrf2, GCLM, and NQO1 in ONH extracts, as measured by qPCR. Data are normalized for rhodopsin and expressed relative to controls. Values represent mean ± SEM, where n = 12–14. **P < 0.01, by Student's unpaired t-test. (D–G) Expression of the antioxidant enzymes SOD-1, SOD-2, and Prdx6 in optic nerve head (ONH) extracts at 1 and 3 d after induction of ocular hypertension, as determined by Western immunoblotting. Representative immunoblots from three animals at each time point are shown (C, control ONH; T, treated ONH). Single bands of the expected molecular weight are apparent. β-actin immunoblots for the same samples are also shown, as gel-loading controls. Values (represented as mean ± SEM, where n = 12–14) are normalized for actin and expressed relative to controls. ***P < 0.001, by Student's unpaired t-test. (H) Quantification of Prdx6 mRNA expression in ONH extracts, as measured by qPCR. All values represent mean ± SEM, where n = 14. Data are normalized for rhodopsin and expressed relative to controls. (I,J) Representative images of Prdx6 immunolabeling in ONH tissue sections from control and OHT eyes. Prdx6 is associated with astrocytes, but appears unchanged following OHT. (K–M) Representative images of SOD-2 immunolabeling in ONH tissue sections from control and eyes subjected to 3 d of OHT. In controls optic nerves, SOD-2 expression is conspicuous within axon bundles. Following 3 d of OHT, injured axon bundles display robust, punctate SOD-2 immunolabeling (arrows). Scale bar: (I,J) = 100 μm; (K–M) = 50 μm.
Figure 10
Figure 10
Increased superoxide production in the retina and prelaminar optic nerve head (ONH) after induction of ocular hypertension (OHT). (A–F) Representative images of sections of the prelaminar ONH and retina incubated with dihydroethidium (DHE, red) from a control eye, and from eyes subjected to ocular hypertension for 1 and 3 days. Sections are counterstained with the nuclear dye DAPI. Negligible fluorescence is evident in sections from the control. In contrast, after 1 day of OHT, cells residing within the retinal ganglion cell layer (GCL, arrow), some cells within the inner nuclear layer (INL), and glial cells at the ONH display DHE fluorescence. After 3d of OHT, DHE staining is more prominent, notably by cells in the INL (arrowhead) and at the ONH. ONL, outer nuclear layer. (G–I) Double labeling immunofluorescence of DHE (red) with the Müller cell marker CRALBP (green) at 3 days after induction of OHT. Scale bar: 50 μm.
Figure 11
Figure 11
Evaluation of NADPH oxidase-2 (NOX-2) and 8-hydroxy-2′-deoxyguanosine in the optic nerve head (ONH) after induction of ocular hypertension (OHT). (A) Quantification of NOX-2 mRNA in ONH extracts, as measured by qPCR. Data are normalized for rhodopsin and expressed relative to controls. Values represent mean ± SEM, where n = 12–14. *P < 0.05, by Student's unpaired t-test. (B,C) Expression of the regulatory subunit for NOX-2, p67phox, in optic nerve head (ONH) extracts at 1 and 3 d after induction of ocular hypertension, as determined by Western immunoblotting. Representative immunoblots from three animals at each time point are shown (C, control ONH; T, treated ONH). Single bands of the expected molecular weight are apparent. β-actin immunoblots for the same samples are also shown, as gel-loading controls. Values (represented as mean ± SEM, where n = 12–14) are normalized for actin and expressed relative to controls. **P < 0.01, by Student's unpaired t-test. (D–K) Representative images of gp91phox (the catalytic subunit of NOX-2) immunolabeling in tissue sections from control and OHT eyes. (D–G) After 24 h of OHT, gp91phox-positive cells (G, arrows) are evident in ONHs from some OHT rats, but not in others (F). The presence of gp91phox expression appears not to be related to the exent of axonal transport disruption, shown alongside for comparative purposes (D,F). (H–K) After 3 d of OHT, all OHT eyes feature gp91phox-positive cells, throughout the prelaminar (H) and laminar ONH (I–K). Double labeling immunofluorescence of gp91phox (red) with iba1 (green) reveals an almost complete co-localization in microglia (I–K). (L) Quantification of gp91phox immunolabeling in the ONH. Values represent mean ± SEM, where n = 12–16. **P < 0.01, by Student's unpaired t-test. (M,N) Representative images of 8-hydroxy-2′-deoxyguanosine (8-hydroxy-2′-dG) immunolabeling in the retina following injection of the excitotoxic glutamatergic agonist, N-methyl-D-aspartate, and in the ONH (also shown in G) after 24 h of OHT. 8-Hydroxy-2′-dG-positive cells are numerous in the positive control specimen, but not within the ONH of OHT rats. Scale bar: (D–G,N) = 50 μm; (H–K,M) = 25 μm.

References

    1. Ahmed J., Linsenmeier R. A., Dunn R., Jr. (1994). The oxygen distribution in the prelaminar optic nerve head of the cat. Exp. Eye Res. 59, 457–465. 10.1006/exer.1994.1131 - DOI - PubMed
    1. Anderson D. R., Hendrickson A. (1974). Effect of intraocular pressure on rapid axoplasmic transport in monkey optic nerve. Invest. Ophthalmol. 13, 771–783. - PubMed
    1. Arteel G. E., Thurman R. G., Yates J. M., Raleigh J. A. (1995). Evidence that hypoxia markers detect oxygen gradients in liver: pimonidazole and retrograde perfusion of rat liver. Br. J. Cancer 72, 889–895. 10.1038/bjc.1995.429 - DOI - PMC - PubMed
    1. Aslan M., Dogan S., Kucuksayan E. (2013). Oxidative stress and potential applications of free radical scavengers in glaucoma. Redox Rep. 18, 76–87. 10.1179/1351000212Y.0000000033 - DOI - PMC - PubMed
    1. Balaratnasingam C., Morgan W. H., Bass L., Matich G., Cringle S. J., Yu D. Y. (2007). Axonal transport and cytoskeletal changes in the laminar regions after elevated intraocular pressure. Invest. Ophthalmol. Vis. Sci. 48, 3632–3644. 10.1167/iovs.06-1002 - DOI - PubMed

LinkOut - more resources