

Metabolic heterogeneity of idiopathic pulmonary fibrosis: a metabolomic study
- PMID: 28883924
- PMCID: PMC5531310
- DOI: 10.1136/bmjresp-2017-000183
Metabolic heterogeneity of idiopathic pulmonary fibrosis: a metabolomic study
Abstract
Introduction: Idiopathic pulmonary fibrosis (IPF) is a chronic and fatal disease of unknown cause characterised by progressive fibrotic formation in lung tissue. We hypothesise that disrupted metabolic pathways in IPF contribute to disease pathogenesis.
Methods: Metabolomics of human IPF was performed using mass spectroscopy (IPF lung=8; donor lung=8). Gene expression of key metabolic enzymes was measured using microarrays. Of the 108 metabolites whose levels were found altered, 48 were significantly increased, whereas 60 were significantly decreased in IPF samples compared with normal controls.
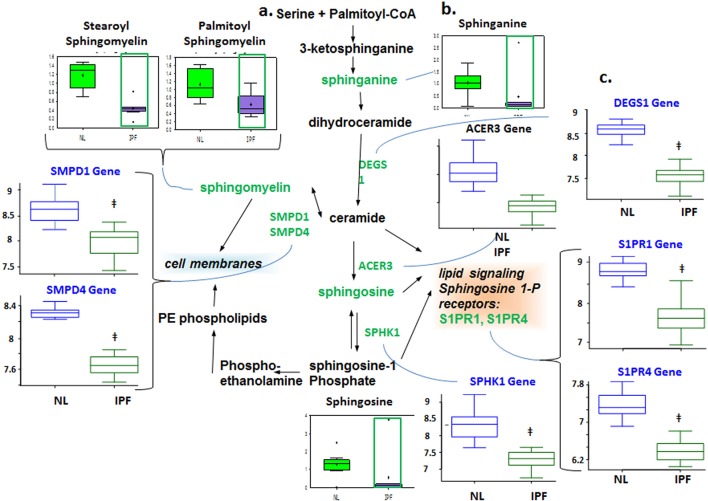
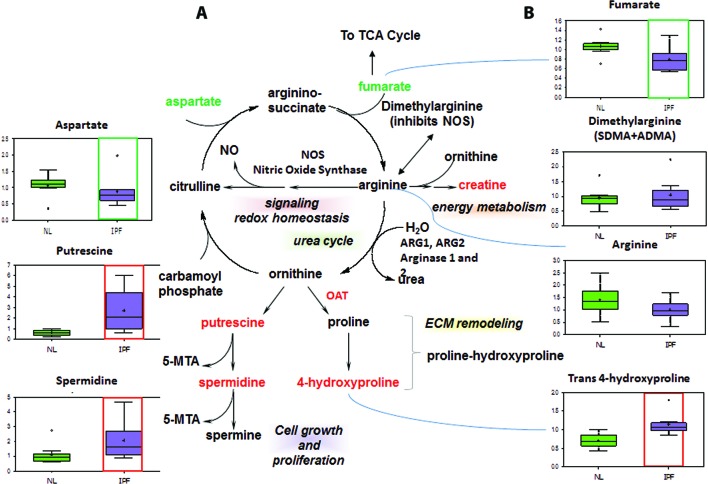
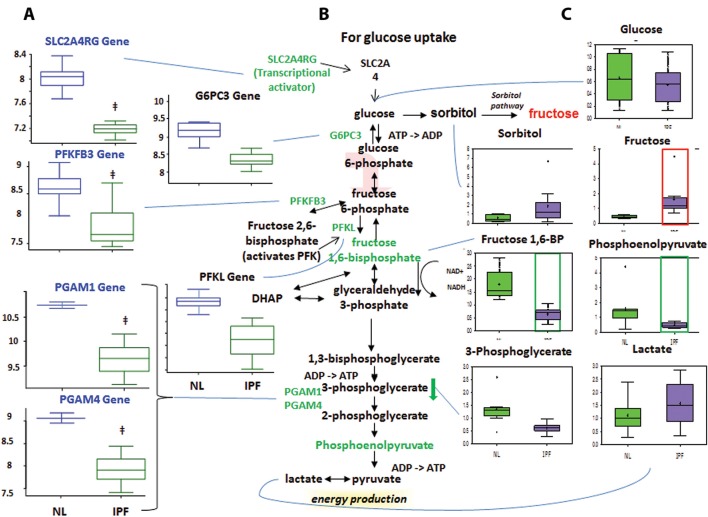
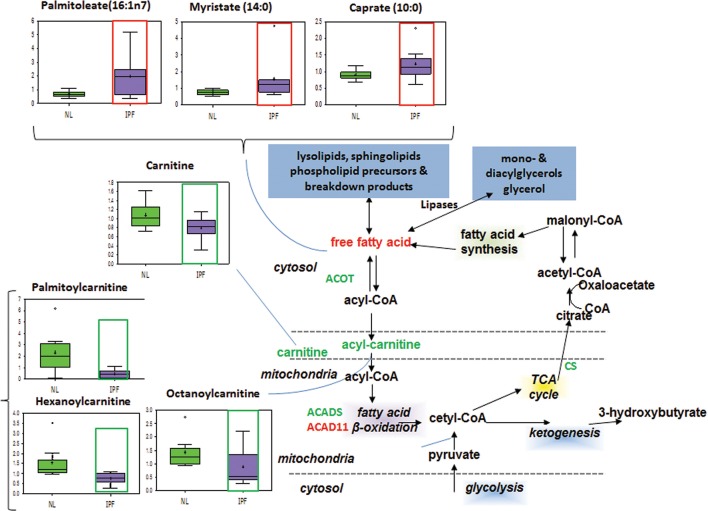
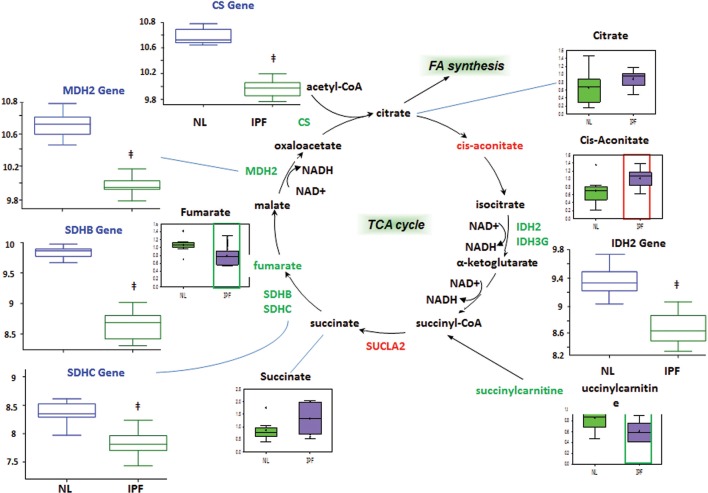
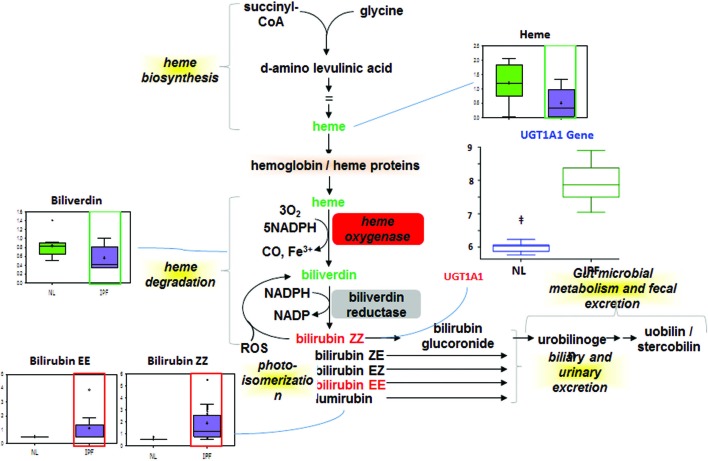
Results: Specific metabolic pathways mediating the IPF remodelling were found with a downregulated sphingolipid metabolic pathway but an upregulated arginine pathway in IPF. In addition, disrupted glycolysis, mitochondrial beta-oxidation and tricarboxylic acid cycle, altered bile acid, haem and glutamate/aspartate metabolism were found in IPF samples compared with control.
Conclusions: Our results show alterations in metabolic pathways for energy consumption during lung structural remodelling, which may contribute to IPF pathogenesis. We believe that this is the first report of simultaneously and systemically measuring changes of metabolites involving nine metabolic pathways in human severe IPF lungs. The measurement of the metabolites may serve in the future diagnosis and prognosis of IPF.
Keywords: interstitial fibrosis; lung transplantation.
Conflict of interest statement
Competing interests: None declared.
Figures
Similar articles
-
Metabolic Profiling Regarding Pathogenesis of Idiopathic Pulmonary Fibrosis.J Proteome Res. 2016 May 6;15(5):1717-24. doi: 10.1021/acs.jproteome.6b00156. Epub 2016 Apr 18. J Proteome Res. 2016. PMID: 27052453
-
Mapping the metabolomic and lipidomic changes in the bleomycin model of pulmonary fibrosis in young and aged mice.Dis Model Mech. 2022 Jan 1;15(1):dmm049105. doi: 10.1242/dmm.049105. Epub 2022 Jan 25. Dis Model Mech. 2022. PMID: 34845494 Free PMC article.
-
Metabolomic analysis of fibrotic mice combined with public RNA-Seq human lung data reveal potential diagnostic biomarker candidates for lung fibrosis.FEBS Open Bio. 2020 Nov;10(11):2427-2436. doi: 10.1002/2211-5463.12982. Epub 2020 Oct 5. FEBS Open Bio. 2020. PMID: 32961634 Free PMC article.
-
Glycolysis Reprogramming in Idiopathic Pulmonary Fibrosis: Unveiling the Mystery of Lactate in the Lung.Int J Mol Sci. 2023 Dec 25;25(1):315. doi: 10.3390/ijms25010315. Int J Mol Sci. 2023. PMID: 38203486 Free PMC article. Review.
-
Idiopathic Pulmonary Fibrosis: Aging, Mitochondrial Dysfunction, and Cellular Bioenergetics.Front Med (Lausanne). 2018 Feb 5;5:10. doi: 10.3389/fmed.2018.00010. eCollection 2018. Front Med (Lausanne). 2018. PMID: 29459894 Free PMC article. Review.
Cited by
-
Pathogenesis and Therapy of Hermansky-Pudlak Syndrome (HPS)-Associated Pulmonary Fibrosis.Int J Mol Sci. 2024 Oct 19;25(20):11270. doi: 10.3390/ijms252011270. Int J Mol Sci. 2024. PMID: 39457053 Free PMC article. Review.
-
Mitochondria, Aging, and Cellular Senescence: Implications for Scleroderma.Curr Rheumatol Rep. 2020 Jun 19;22(8):37. doi: 10.1007/s11926-020-00920-9. Curr Rheumatol Rep. 2020. PMID: 32562128 Free PMC article. Review.
-
Endometrial organoids: a reservoir of functional mitochondria for uterine repair.Theranostics. 2024 Jan 1;14(3):954-972. doi: 10.7150/thno.90538. eCollection 2024. Theranostics. 2024. PMID: 38250040 Free PMC article.
-
Challenges for Clinical Drug Development in Pulmonary Fibrosis.Front Pharmacol. 2022 Jan 31;13:823085. doi: 10.3389/fphar.2022.823085. eCollection 2022. Front Pharmacol. 2022. PMID: 35173620 Free PMC article. Review.
-
Dysfunctional lactate metabolism in human alveolar type II cells from idiopathic pulmonary fibrosis lung explant tissue.Respir Res. 2021 Oct 28;22(1):278. doi: 10.1186/s12931-021-01866-x. Respir Res. 2021. PMID: 34711218 Free PMC article.
References
-
- Kekevian A, Gershwin ME, Chang C. Diagnosis and classification of idiopathic pulmonary fibrosis. Autoimmun Rev 2014;13:508–12.doi:10.1016/j.autrev.2014.01.037 - DOI - PubMed
-
- King TE, Pardo A, Selman M. Idiopathic pulmonary fibrosis. Lancet 2011;378:1949–61.doi:10.1016/S0140-6736(11)60052-4 - DOI - PubMed
-
- Wolters PJ, Collard HR, Jones KD. Pathogenesis of idiopathic pulmonary fibrosis. Annu Rev Pathol 2014;9:157–79.doi:10.1146/annurev-pathol-012513-104706 - DOI - PMC - PubMed
-
- Chambers RC, Scotton CJ. Coagulation cascade proteinases in lung injury and fibrosis. Proc Am Thorac Soc 2012;9:96–101.doi:10.1513/pats.201201-006AW - DOI - PubMed
-
- Camera L, Campanile F, Imbriaco M, et al. . Idiopathic pulmonary fibrosis complicated by acute thromboembolic disease: chest X-ray, HRCT and multi-detector row CT angiographic findings. J Thorac Dis 2013;5:82–6.doi:10.3978/j.issn.2072-1439.2012.12.03 - DOI - PMC - PubMed
LinkOut - more resources
Full Text Sources
Other Literature Sources