. 2017 Aug 24:7:381.
doi: 10.3389/fcimb.2017.00381. eCollection 2017.

Alterations of the Gut Microbiome in Hypertension

Affiliations

Alterations of the Gut Microbiome in Hypertension

Qiulong Yan et al. Front Cell Infect Microbiol. .

Abstract

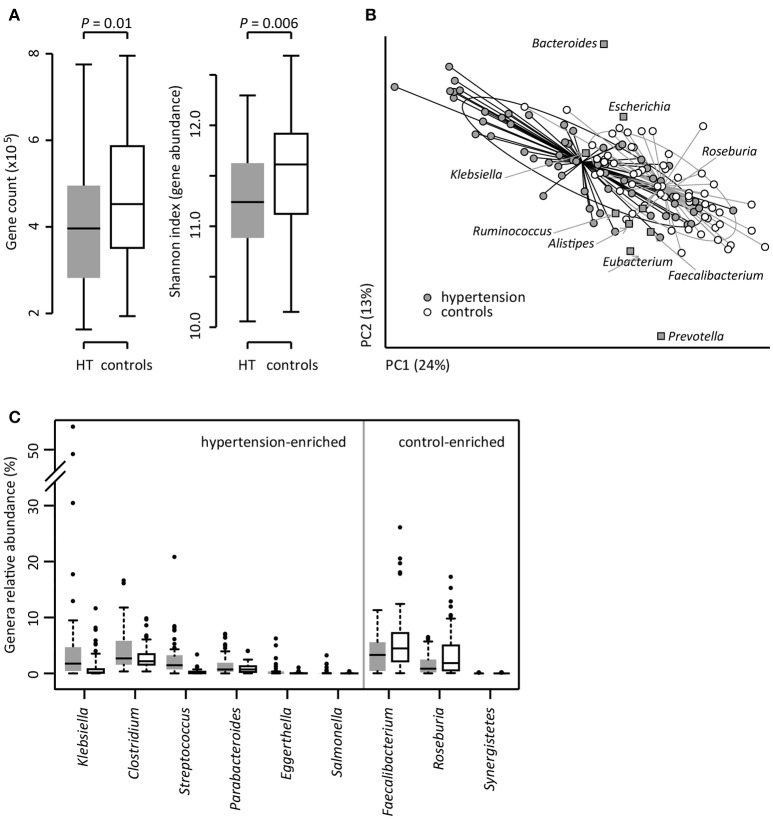
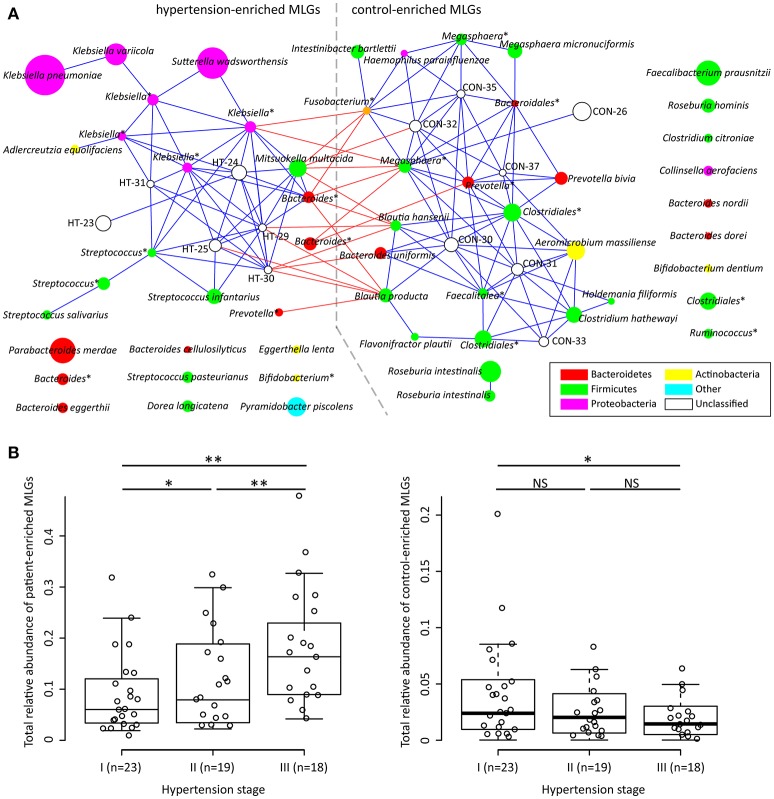
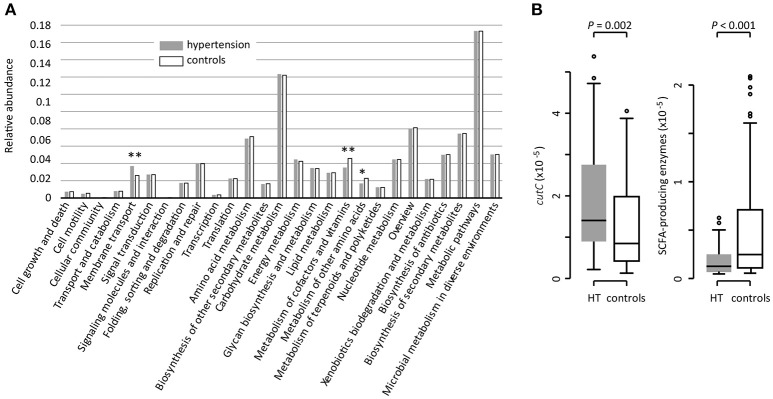
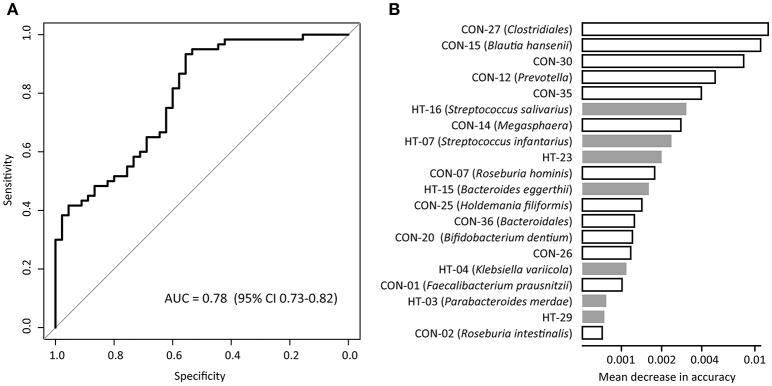
Introduction: Human gut microbiota is believed to be directly or indirectly involved in cardiovascular diseases and hypertension. However, the identification and functional status of the hypertension-related gut microbe(s) have not yet been surveyed in a comprehensive manner. Methods: Here we characterized the gut microbiome in hypertension status by comparing fecal samples of 60 patients with primary hypertension and 60 gender-, age-, and body weight-matched healthy controls based on whole-metagenome shotgun sequencing. Results: Hypertension implicated a remarkable gut dysbiosis with significant reduction in within-sample diversity and shift in microbial composition. Metagenome-wide association study (MGWAS) revealed 53,953 microbial genes that differ in distribution between the patients and healthy controls (false discovery rate, 0.05) and can be grouped into 68 clusters representing bacterial species. Opportunistic pathogenic taxa, such as, Klebsiella spp., Streptococcus spp., and Parabacteroides merdae were frequently distributed in hypertensive gut microbiome, whereas the short-chain fatty acid producer, such as, Roseburia spp. and Faecalibacterium prausnitzii, were higher in controls. The number of hypertension-associated species also showed stronger correlation to the severity of disease. Functionally, the hypertensive gut microbiome exhibited higher membrane transport, lipopolysaccharide biosynthesis and steroid degradation, while in controls the metabolism of amino acid, cofactors and vitamins was found to be higher. We further provided the microbial markers for disease discrimination and achieved an area under the receiver operator characteristic curve (AUC) of 0.78, demonstrating the potential of gut microbiota in prediction of hypertension. Conclusion: These findings represent specific alterations in microbial diversity, genes, species and functions of the hypertensive gut microbiome. Further studies on the causality relationship between hypertension and gut microbiota will offer new prospects for treating and preventing the hypertension and its associated diseases.

Keywords: gut microbiome; hypertension; metagenome-wide association study; microbial dysbiosis.


Figures

Figure 1
Figure 1
Difference of gut microbial community between hypertensive patients and controls. (A), Difference of alpha diversity between hypertensive (HT) patients and controls. (B), dbRDA based on the Bray-Curtis distances between microbial genera, revealing a hypertensive microbial dysbiosis which overlaps only in part with taxonomic composition in patients and controls. The first two principle components and the ratio of variance contributed is shown. Genera (square) as the main contributors are plotted by their loadings in these two components. Lines connect samples in the same group, and circles cover samples near the center of gravity for each group. (C), Boxplot shows the significantly different genera between patients and controls. Genera with q < 0.05 (Mann-Whitney U-test corrected by FDR) are shown. Only the genera with average relative abundances greater than 0.05% of total abundance in all samples are shown for clarity. Gray and white boxes represent the patients and controls, respectively. For A and C, the boxes represent the interquartile range (IQR) between first and third quartiles and the line inside represents the median. The whiskers denote the lowest and highest values within 1.5 times IQR from the first and third quartiles, respectively. The dots represent outliers beyond the whiskers.
Figure 2
Figure 2
Characterization and interconnection of hypertension-associated MLGs. (A) Co-occurrence network shows the interconnection of the hypertension- and control-enriched MLGs. Nodes depict MLGs with their ID or taxonomic assignment (unclassified MLGs under genus or higher taxonomy rank are marked by “*”) displayed in the center. The size of the nodes indicates the number of gene within the MLG. Connecting lines represent Spearman correlation coefficient ρ > 0.40 (represented by blue line) or < −0.40 (represented by red line). (B), Correlation of gross abundance of hypertension- and control-enriched MLGs with hypertension stage. NS, not significant; *, q < 0.05; **, q < 0.01; Mann-Whitney U-test corrected by FDR.
Figure 3
Figure 3
Functional comparison of the gut microbiomes between hypertensive patients and healthy controls. (A), Distributions of relative abundances of KEGG pathway categories in hypertensive patients and controls. *, q < 0.05; **, q < 0.01; Mann-Whitney U-test corrected by FDR. (B), Difference of the relative abundance of cutC (TMA-producing) and SCFA-producing enzymes between hypertensive (HT) patients and controls.
Figure 4
Figure 4
Classification of hypertension status by the abundances of MLGs. (A), ROC analysis for classification of hypertensive status by MLGs, assessed by AUC. (B), The 20 most discriminant MLGs in the model classifying hypertensive patients and healthy controls. The bar lengths indicate the importance of the variable, and colors represent enrichment in patients (black) or controls (white).

References

    1. Adnan S., Nelson J. W., Ajami N. J., Venna V. R., Petrosino J. F., Bryan R. M., Jr., et al. (2017). Alterations in the gut microbiota can elicit hypertension in rats. Physiol. Genomics 49, 96–104. 10.1152/physiolgenomics.00081.2016 - DOI - PMC - PubMed
    1. Boente R. F., Ferreira L. Q., Falcao L. S., Miranda K. R., Guimaraes P. L., Domingues R. M., et al. (2010). Detection of resistance genes and susceptibility patterns in Bacteroides and Parabacteroides strains. Anaerobe 16, 190–194. 10.1016/j.anaerobe.2010.02.003 - DOI - PubMed
    1. Brisse S., Duijkeren E. (2005). Identification and antimicrobial susceptibility of 100 Klebsiella animal clinical isolates. Vet. Microbiol. 105, 307–312. 10.1016/j.vetmic.2004.11.010 - DOI - PubMed
    1. Conte M. P., Schippa S., Zamboni I., Penta M., Chiarini F., Cucchiara S., et al. (2006). Gut-associated bacterial microbiota in paediatric patients with inflammatory bowel disease. Gut 55, 1760–1767. 10.1136/gut.2005.078824 - DOI - PMC - PubMed
    1. Craciun S., Balskus E. P. (2012). Microbial conversion of choline to trimethylamine requires a glycyl radical enzyme. Proc. Natl. Acad. Sci. U.S.A. 109, 21307–21312. 10.1073/pnas.1215689109 - DOI - PMC - PubMed

Publication types