. 2018;35(1):65-76.
doi: 10.14573/altex.1704171. Epub 2017 Sep 8.

Ex vivo model unravelling cell distribution effect in hydrogels for cartilage repair

Affiliations

Ex vivo model unravelling cell distribution effect in hydrogels for cartilage repair

Vivian H M Mouser et al. ALTEX. 2018.

Abstract

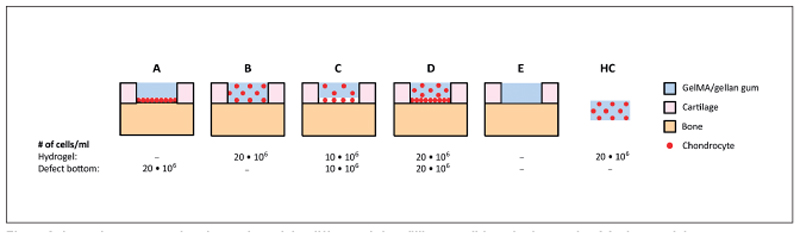
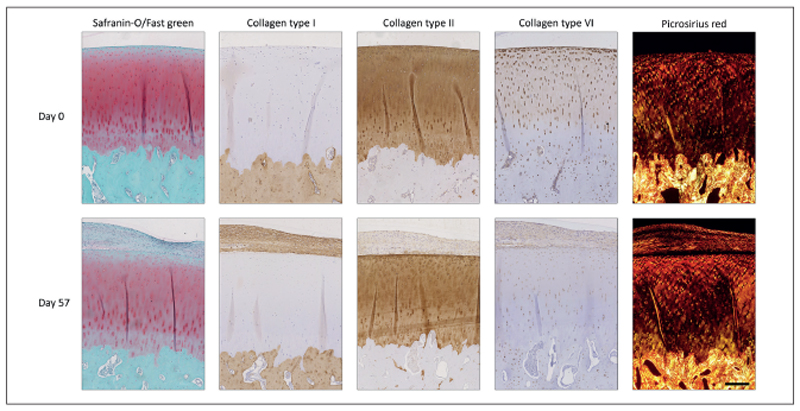
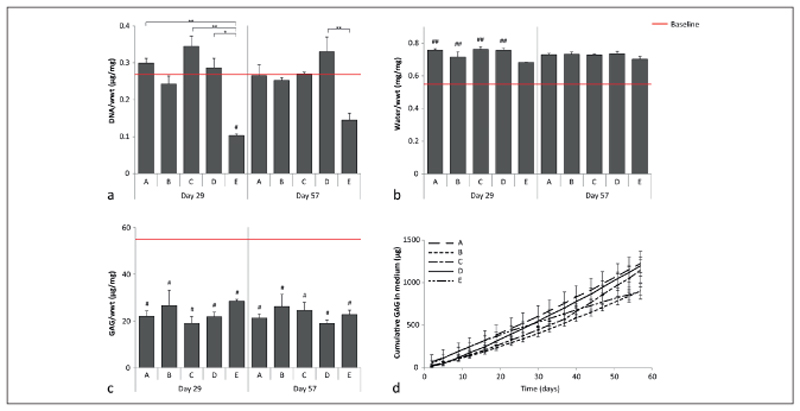
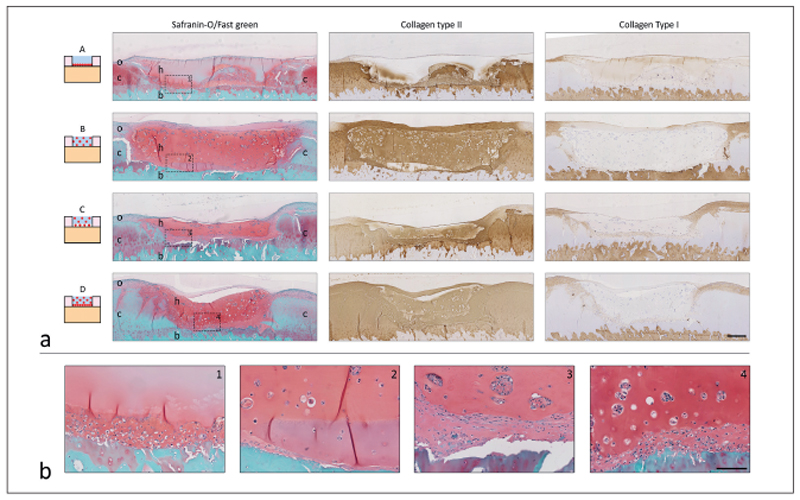
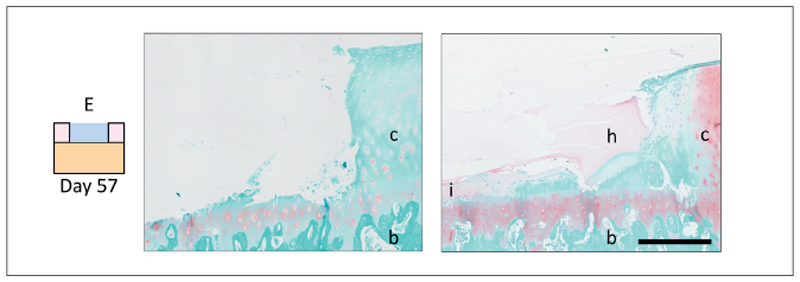
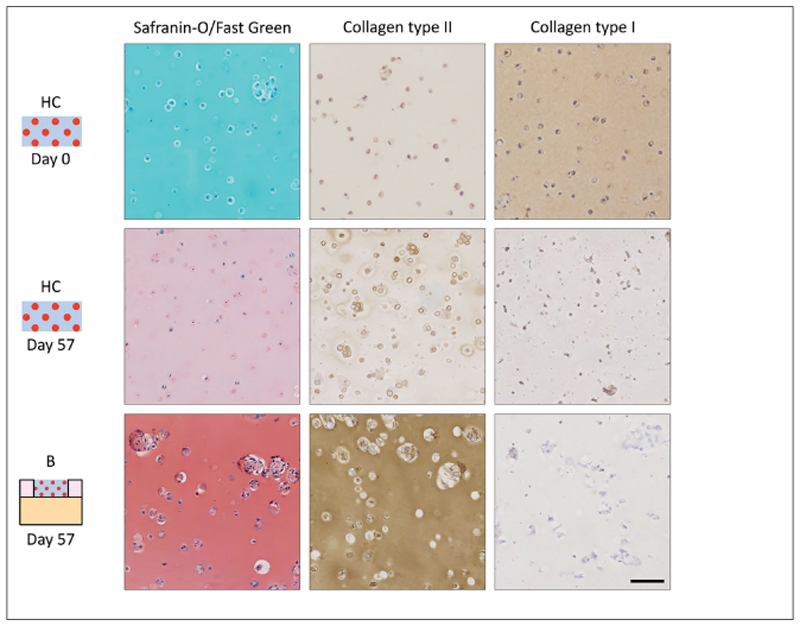
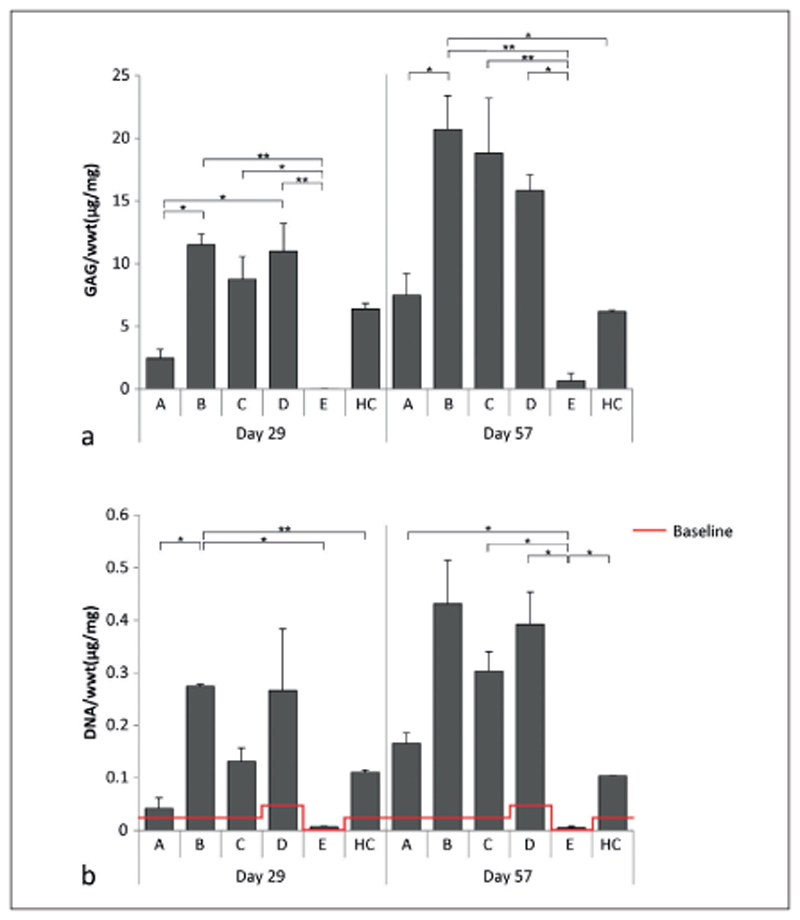
The implantation of chondrocyte-laden hydrogels is a promising cartilage repair strategy. Chondrocytes can be spatially positioned in hydrogels and thus in defects, while current clinical cell therapies introduce chondrocytes in the defect depth. The main aim of this study was to evaluate the effect of spatial chondrocyte distribution on the reparative process. To reduce animal experiments, an ex vivo osteochondral plug model was used and evaluated. The role of the delivered and endogenous cells in the repair process was investigated. Full thickness cartilage defects were created in equine osteochondral plugs. Defects were filled with (A) chondrocytes at the bottom of the defect, covered with a cell-free hydrogel, (B) chondrocytes homogeneously encapsulated in a hydrogel, and (C, D) combinations of A and B with different cell densities. Plugs were cultured for up to 57 days, after which the cartilage and repair tissues were characterized and compared to baseline samples. Additionally, at day 21, the origin of cells in the repair tissue was evaluated. Best outcomes were obtained with conditions C and D, which resulted in well-integrated cartilage-like tissue that completely filled the defect, regardless of the initial cell density. A critical role of the spatial chondrocyte distribution in the repair process was observed. Moreover, the osteochondral plugs stimulated cartilage formation in the hydrogels when cultured in the defects. The resulting repair tissue originated from the delivered cells. These findings confirm the potential of the osteochondral plug model for the optimization of the composition of cartilage implants and for studying repair mechanisms.

Keywords: GelMA/gellan gum; cartilage repair; osteochondral plug; regeneration.


Conflict of interest statement

Conflict of interest

The authors have no conflicts of interest to declare.

Figures

Fig. 1
Fig. 1. Schematic cross-sectional overview of the different defect filling conditions in the ex vivo OC plug model
Chondrocytes were seeded at the bottom of the defect (A, 20x106 cells/ml), homogeneously in the hydrogel (B, 20x106 cell/ml), both at the bottom of the defect and in the hydrogel (C, 10x106 cell/ml + 10x106 cell/ml, respectively; D, 20x106 cell/ml + 20x106 cell/ml, respectively). An empty hydrogel was used as control (E). All defects were filled with a total of 10 μl hydrogel. To evaluate the influence of the ex vivo OC plug model on the tissue production of the delivered chondrocytes, a cell-laden hydrogel control (HC, 20x106 cell/ml) also was cultured.
Fig. 2
Fig. 2. Change in native cartilage and bone morphology of the OC plugs during the culture period
Images of day 57 are from the tissue surrounding the cartilage defect which was filled with condition A and are representative for all conditions which received chondrocytes in the defect (# plugs = 16). GAG content of the cartilage stained less intensely after 57 days of culture. Additionally, new tissue grew over the defect area and covered the cartilage surface during culture. Scale bar represents 400 μm and is valid for all images.
Fig. 3
Fig. 3. Quantitative measurement of DNA, GAGs and water content of the native cartilage surrounding the defects filled with the different conditions
a) DNA normalized to wwt; b) Water content normalized to wwt; c) GAG normalized to wwt; d) cumulative GAGs measured in the medium. Baseline (red) indicates the average value measured at day 0 (# plugs = 3). For conditions A-D, 3 and 4 plugs were measured at days 29 and 57, respectively, while 2 and 3 plugs were measured respectively for E. # represents a significant difference compared to the baseline (#, p < 0.05; ##, p < 0.01), and * indicates a significant difference between the connected conditions (*, p < 0.05; **, p < 0.01).
Fig. 4
Fig. 4. Histological analysis of cartilage defects filled with conditions A-D at day 57
a) Cross-sectional overview of each condition (# plugs = 4). Scale bar represents 400 μm and is the same for all histological images. In the safranin-O images, c, native cartilage; b, bone; h, hydrogel; o, tissue outgrowth. b) Magnification of the area indicated with the dotted square and number in the safranin-O pictures of the cross-sectional overview (a). From left to right conditions A-D. Scale bar represents 100 μm and is the same for all enlarged images.
Fig. 5
Fig. 5. Cross-sectional overview of the side of the defect area of plugs filled with condition E
No signs of tissue remodeling or repair were visible in most of the three samples (left, hydrogel absent) while in one sample, cells were visible at the bottom of the defect after 57 days of culture (right). Scale bar represents 400 μm; c, native cartilage; b, bone; I, cell infiltration; h, hydrogel.
Fig. 6
Fig. 6. Overview of matrix production in hydrogel controls and the hydrogel constructs in condition B
Scale bar represents 200 μm for all images; representative images of 4 plugs and 4 HCs.
Fig. 7
Fig. 7. Quantitative measurements of the different defect fillings
a) GAG normalized to wwt. No GAGs were detected in the defect filling at day 1. b) DNA normalized to the wwt. At day 1 (baseline, red), 0.023 ±0.0014 μg/mg DNA/wwt was detected for defects filled with conditions A, B, C, and HC, while 0.047 ±0.0029 μg/mg DNA/wwt was detected in plugs filled with condition D, and no DNA was detected for plugs filled with condition E. For condition A-D, 3 and 4 plugs were measured at days 29 and 57, respectively, while 2 and 3 plugs were measured respectively for condition E. *, p < 0.05; **, p < 0.01 between the connected conditions.

References

    1. Abbadessa A, Mouser VHM, Blokzijl MM, et al. A synthetic thermosensitive hydrogel for cartilage bioprinting and its biofunctionalization with polysaccharides. Biomacromolecules. 2016;17:2137–2147. doi: 10.1021/acs.biomac.6b00366. - DOI - PMC - PubMed
    1. Abbott J, Holtzer H. The loss of phenotypic traits by differentiated cells: III. The reversible behavior of chondrocytes in primary cultures. J Cell Biol. 1966;28:473–487. doi: 10.1083/jcb.28.3.473. - DOI - PMC - PubMed
    1. Almarza AJ, Athanasiou KA. Design characteristics for the tissue engineering of cartilaginous tissues. Ann Biomed Eng. 2004;32:2–17. - PubMed
    1. Benninghoff A. Form und Bau der Gelenkknorpel in ihren Beziehungen zur Funktion. Z Anat Entwicklungsgesch. 1925;76:43–63. doi: 10.1007/BF02134417. - DOI
    1. Bian L, Fong JV, Lima EG, et al. Dynamic mechanical loading enhances functional properties of tissue-engineered cartilage using mature canine chondrocytes. Tissue Eng Part A. 2010;16:1781–1790. doi: 10.1089/ten.tea.2009.0482. - DOI - PMC - PubMed

LinkOut - more resources