Review
. 2017 Dec 15;123(24):4914-4923.
doi: 10.1002/cncr.30934. Epub 2017 Sep 8.

Historical time to disease progression and progression-free survival in patients with recurrent/refractory neuroblastoma treated in the modern era on Children's Oncology Group early-phase trials

Affiliations
Review

Historical time to disease progression and progression-free survival in patients with recurrent/refractory neuroblastoma treated in the modern era on Children's Oncology Group early-phase trials

Wendy B London et al. Cancer. .

Abstract

Background: Early-phase trials in patients with recurrent neuroblastoma historically used an objective "response" of measureable disease (Response Evaluation Criteria In Solid Tumors [RECIST], without bone/bone marrow assessment) to select agents for further study. Historical cohorts may be small and potentially biased; to the authors' knowledge, disease recurrence studies from international registries are outdated. Using a large recent cohort of patients with recurrent/refractory neuroblastoma from Children's Oncology Group (COG) modern-era early-phase trials, the authors determined outcome and quantified parameters for designing future studies.

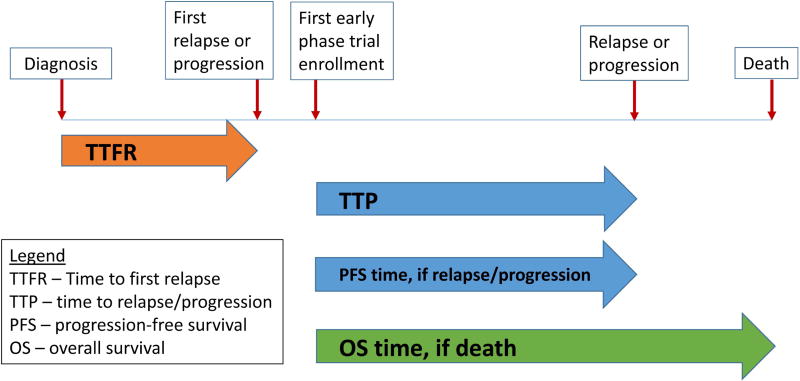
Methods: The first early-phase COG trial enrollment (sequential) of 383 distinct patients with recurrent/refractory neuroblastoma on 23 phase 1, 3 phase 1/2, and 9 phase 2 trials (August 2002 to January 2014) was analyzed for progression-free survival (PFS), overall survival (OS), and time to disease progression (TTP). Planned frontline therapy for patients with high-risk neuroblastoma included hematopoietic stem cell transplantation (approximately two-thirds of patients underwent ≥1 hematopoietic stem cell transplantation); 13.2% of patients received dinutuximab.

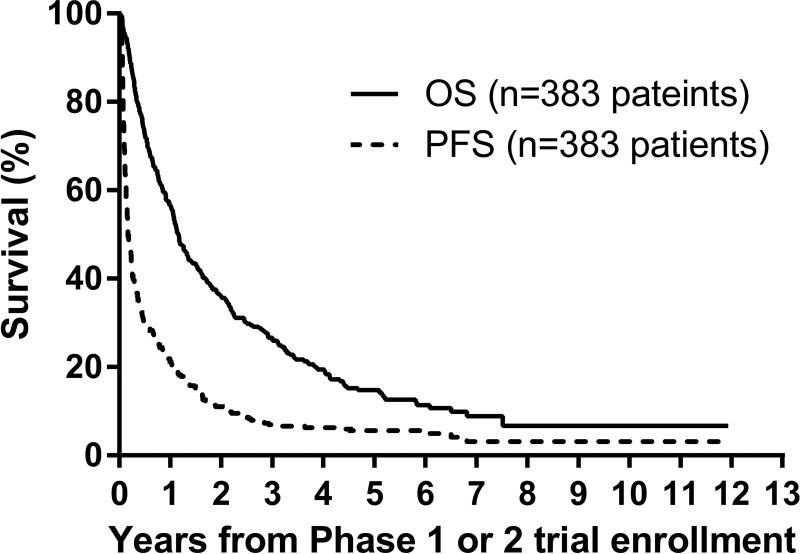
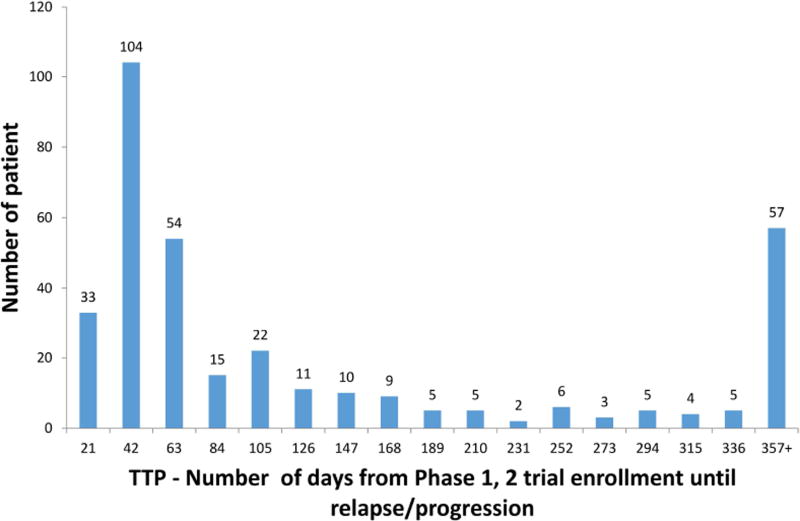
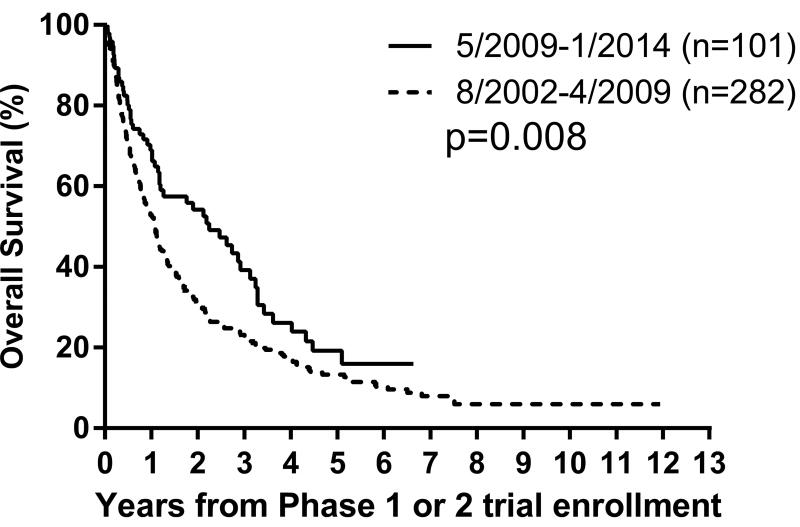
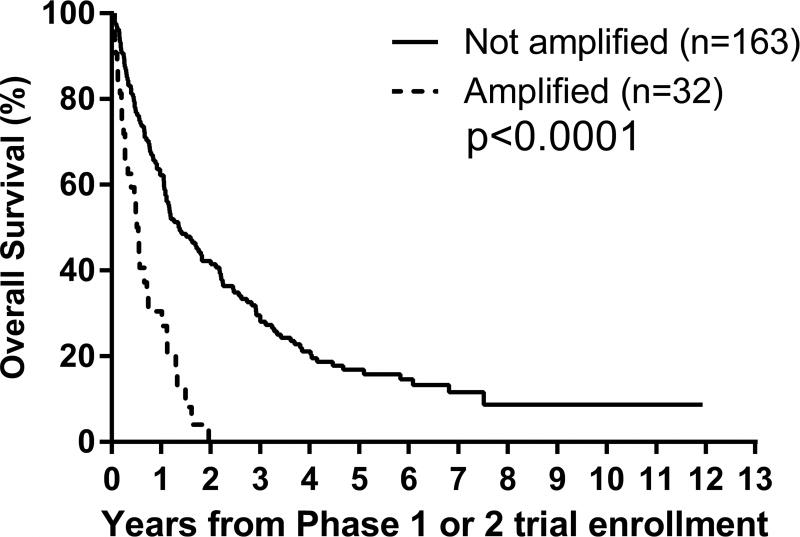
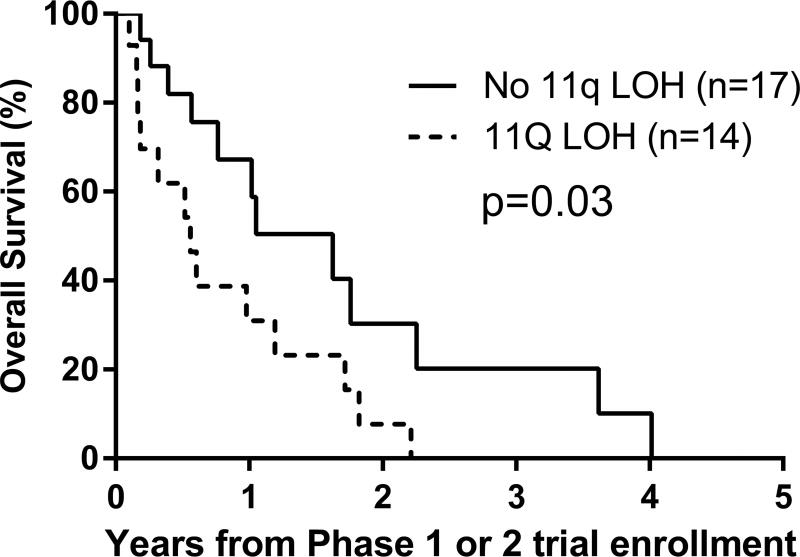
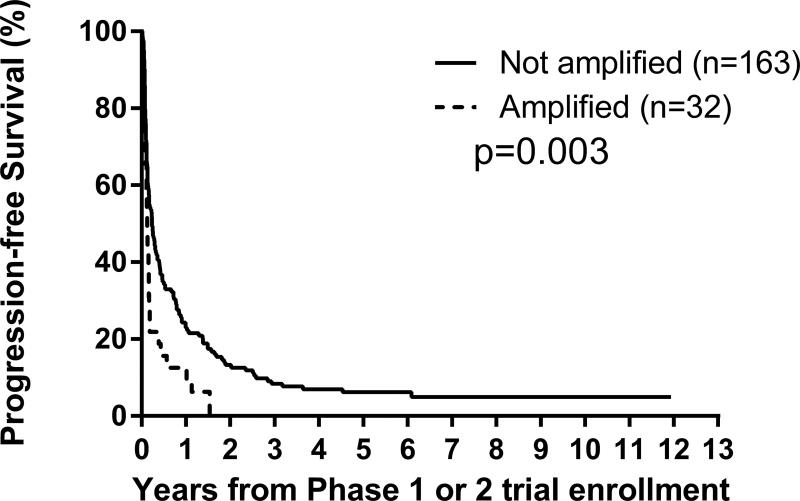
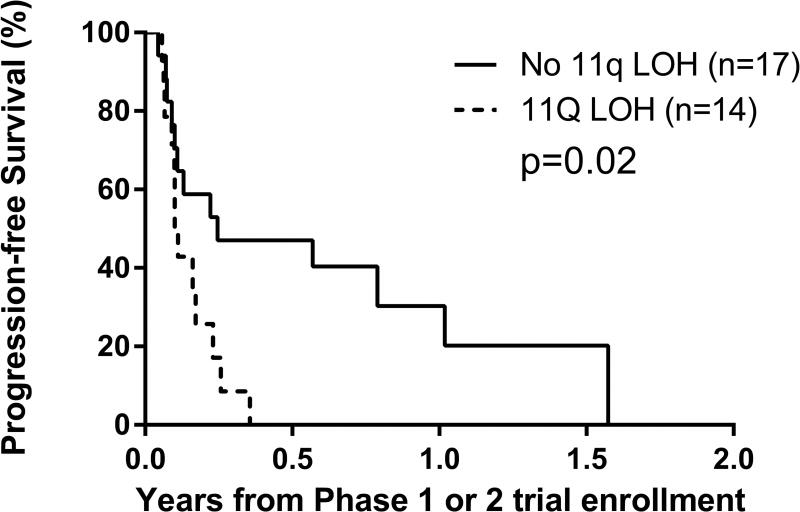
Results: From the time of the patient's first early-phase trial enrollment (383 patients), the 1-year and 4-year PFS rates ( ± standard error) were 21% ± 2% and 6% ± 1%, respectively, whereas the 1-year and 4-year OS rates were 57% ± 3% and 20% ± 2%, respectively. The median TTP was 58 days (interquartile range, 31-183 days [350 patients]); the median follow-up was 25.3 months (33 patients were found to be without disease recurrence/progression). The median time from diagnosis to first disease recurrence/progression was 18.7 months (range, 1.4-64.8 months) (176 patients). MYCN amplification and 11q loss of heterozygosity were prognostic of worse PFS and OS (P = .003 and P<.0001, respectively, and P = .02 and P = .03, respectively) after early-phase trial enrollment.

Conclusions: This recent COG cohort of patients with recurrent/refractory neuroblastoma is inclusive and representative. To the authors' knowledge, the current study is the first meta-analysis of PFS, TTP, and OS within the context of modern therapy. These results will inform the design of future phase 2 studies by providing a) historical context during the search for more effective agents; and, b) factors prognostic of PFS and OS after disease recurrence to stratify randomization. Cancer 2017;123:4914-23. © 2017 American Cancer Society.

Keywords: International Neuroblastoma Response Criteria (INRC); Response Evaluation Criteria In Solid Tumors (RECIST); endpoints; historical standard; phase 2 design; prognostic.


Conflict of interest statement

Conflicts of Interest Statement

All authors (WL, RB, BW, EF, DG, CVR, AN, and JP) declare that they have no conflicts of interest.

Figures

Figure 1
Figure 1
Schematic portrayal of TTFR (time to first relapse/progression after diagnosis), TTP (time to progression after first enrollment on an early-phase trial), PFS time (if neuroblastoma relapse, progression, or death from neuroblastoma), and OS time (if death).
Figure 2
Figure 2
A. Progression-free and overall survival curves from modern-era COG early-phase trials for treatment of relapsed or refractory neuroblastoma: n=383 patients (first early-phase trial enrollment). Survival time is calculated starting from the time of first enrollment onto the early-phase trial. B. Distribution of time from early-phase trial enrollment until relapse/progression (TTP) (the n=350 subset who relapsed/progressed out of the overall 383 patients) C–E. Overall survival curves for 383 patients on modern-era COG early phase trials for treatment of relapsed or refractory neuroblastoma. C. By Era: 8/2002–4/2009 versus 5/2009–2/2014, p=0.008; D. By MYCN status: amplified versus not amplified, p<0.0001; E. By 11q status: LOH versus no LOH, p=0.03. Overall survival time is calculated starting from the time of first enrollment onto the COG early-phase trial. F–G. Progression-free survival curves for 383 patients on modern-era COG early-phase trials for treatment of relapsed or refractory neuroblastoma. F. By MYCN status: amplified versus not amplified, p=0.003; G. By 11q status: LOH versus no LOH, p=0.02. Progression-free survival time is calculated starting from the time of first enrollment onto the COG early-phase trial.
Figure 2
Figure 2
A. Progression-free and overall survival curves from modern-era COG early-phase trials for treatment of relapsed or refractory neuroblastoma: n=383 patients (first early-phase trial enrollment). Survival time is calculated starting from the time of first enrollment onto the early-phase trial. B. Distribution of time from early-phase trial enrollment until relapse/progression (TTP) (the n=350 subset who relapsed/progressed out of the overall 383 patients) C–E. Overall survival curves for 383 patients on modern-era COG early phase trials for treatment of relapsed or refractory neuroblastoma. C. By Era: 8/2002–4/2009 versus 5/2009–2/2014, p=0.008; D. By MYCN status: amplified versus not amplified, p<0.0001; E. By 11q status: LOH versus no LOH, p=0.03. Overall survival time is calculated starting from the time of first enrollment onto the COG early-phase trial. F–G. Progression-free survival curves for 383 patients on modern-era COG early-phase trials for treatment of relapsed or refractory neuroblastoma. F. By MYCN status: amplified versus not amplified, p=0.003; G. By 11q status: LOH versus no LOH, p=0.02. Progression-free survival time is calculated starting from the time of first enrollment onto the COG early-phase trial.

References

    1. Maris JM, Hogarty MD, Bagatell R, et al. Neuroblastoma. Lancet. 2007;369:2106–2120. - PubMed
    1. Brodeur GM. Neuroblastoma: biological insights into a clinical enigma. Nat Rev Cancer. 2003;3:203–216. - PubMed
    1. Therasse P, Arbuck SG, Eisenhauer EA, et al. New guidelines to evaluate the response to treatment in solid tumors. J National Cancer Inst. 2000 Feb 2;92(3):205–16. - PubMed
    1. Brodeur GM, Pritchard J, Berthold F, et al. Revisions of the international criteria for neuroblastoma diagnosis, staging, and response to treatment. J Clin Oncol. 1993 Aug;11(8):1466–1477. - PubMed
    1. Castel V, Garcia-Miguel P, Canete A, et al. Prospective evaluation of the International Neuroblastoma Staging System (INSS) and the International Neuroblastoma Response Criteria (INRC) in a multicentre setting. Eur J Cancer. 1999 Apr;35(4):606–611. - PubMed

MeSH terms

Substances