Incorporating abundance information and guiding variable selection for climate-based ensemble forecasting of species' distributional shifts
- PMID: 28886075
- PMCID: PMC5590900
- DOI: 10.1371/journal.pone.0184316
Incorporating abundance information and guiding variable selection for climate-based ensemble forecasting of species' distributional shifts
Abstract
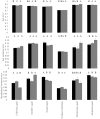
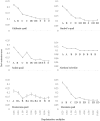
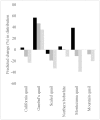
Ecological niche models (ENMs) have increasingly been used to estimate the potential effects of climate change on species' distributions worldwide. Recently, predictions of species abundance have also been obtained with such models, though knowledge about the climatic variables affecting species abundance is often lacking. To address this, we used a well-studied guild (temperate North American quail) and the Maxent modeling algorithm to compare model performance of three variable selection approaches: correlation/variable contribution (CVC), biological (i.e., variables known to affect species abundance), and random. We then applied the best approach to forecast potential distributions, under future climatic conditions, and analyze future potential distributions in light of available abundance data and presence-only occurrence data. To estimate species' distributional shifts we generated ensemble forecasts using four global circulation models, four representative concentration pathways, and two time periods (2050 and 2070). Furthermore, we present distributional shifts where 75%, 90%, and 100% of our ensemble models agreed. The CVC variable selection approach outperformed our biological approach for four of the six species. Model projections indicated species-specific effects of climate change on future distributions of temperate North American quail. The Gambel's quail (Callipepla gambelii) was the only species predicted to gain area in climatic suitability across all three scenarios of ensemble model agreement. Conversely, the scaled quail (Callipepla squamata) was the only species predicted to lose area in climatic suitability across all three scenarios of ensemble model agreement. Our models projected future loss of areas for the northern bobwhite (Colinus virginianus) and scaled quail in portions of their distributions which are currently areas of high abundance. Climatic variables that influence local abundance may not always scale up to influence species' distributions. Special attention should be given to selecting variables for ENMs, and tests of model performance should be used to validate the choice of variables.
Conflict of interest statement
Figures


Similar articles
-
Habitat availability and gene flow influence diverging local population trajectories under scenarios of climate change: a place-based approach.Glob Chang Biol. 2016 Apr;22(4):1572-84. doi: 10.1111/gcb.13189. Epub 2016 Jan 28. Glob Chang Biol. 2016. PMID: 26667878
-
Incorporating spatial autocorrelation into species distribution models alters forecasts of climate-mediated range shifts.Glob Chang Biol. 2014 Aug;20(8):2566-79. doi: 10.1111/gcb.12598. Epub 2014 May 21. Glob Chang Biol. 2014. PMID: 24845950
-
Community science validates climate suitability projections from ecological niche modeling.Ecol Appl. 2020 Sep;30(6):e02128. doi: 10.1002/eap.2128. Epub 2020 Apr 23. Ecol Appl. 2020. PMID: 32223029
-
Major challenges for correlational ecological niche model projections to future climate conditions.Ann N Y Acad Sci. 2018 Oct;1429(1):66-77. doi: 10.1111/nyas.13873. Epub 2018 Jun 20. Ann N Y Acad Sci. 2018. PMID: 29923606 Review.
-
Incorporating local adaptation into forecasts of species' distribution and abundance under climate change.Glob Chang Biol. 2019 Mar;25(3):775-793. doi: 10.1111/gcb.14562. Epub 2019 Jan 24. Glob Chang Biol. 2019. PMID: 30597712 Review.
Cited by
-
The broad scale impact of climate change on planning aerial wildlife surveys with drone-based thermal cameras.Sci Rep. 2023 Mar 17;13(1):4455. doi: 10.1038/s41598-023-31150-5. Sci Rep. 2023. PMID: 36932162 Free PMC article.
-
Potential Current and Future Distribution of the Long-Whiskered Owlet (Xenoglaux loweryi) in Amazonas and San Martin, NW Peru.Animals (Basel). 2022 Jul 13;12(14):1794. doi: 10.3390/ani12141794. Animals (Basel). 2022. PMID: 35883341 Free PMC article.
-
Behavioral modifications lead to disparate demographic consequences in two sympatric species.Ecol Evol. 2019 Jul 24;9(16):9273-9289. doi: 10.1002/ece3.5472. eCollection 2019 Aug. Ecol Evol. 2019. PMID: 31463020 Free PMC article.
-
Collinearity in ecological niche modeling: Confusions and challenges.Ecol Evol. 2019 Aug 20;9(18):10365-10376. doi: 10.1002/ece3.5555. eCollection 2019 Sep. Ecol Evol. 2019. PMID: 31624555 Free PMC article.
-
Genetic variability and population structure of the Montezuma quail (Cyrtonyx montezumae) in the northern limit of its distribution.PeerJ. 2023 Dec 8;11:e16585. doi: 10.7717/peerj.16585. eCollection 2023. PeerJ. 2023. PMID: 38089905 Free PMC article.
References
-
- Walther G-R, Post E, Convey P, Menzel A, Parmesan C, Beebee TJC et al. Ecological responses to recent climate change. Nature 2002;416(6879): 389–395. doi: 10.1038/416389a - DOI - PubMed
-
- Thomas CD, Cameron A, Green RE, Bakkenes M, Beaumont LJ, Collingham YC et al. Extinction risk from climate change. Nature 2004;427(6970): 145–148. doi: 10.1038/nature02121 - DOI - PubMed
-
- Guisan A. Biodiversity: Predictive traits to the rescue. Nat. Clim. Chang. 2014;4: 175–176.
-
- Grinnell J. The niche-relationships of the California thrasher. Auk 1917;34(4): 427–433.
-
- Veneir LA, MCkenney DW, Wang Y, McKee J. Models of large-scale breeding-bird distribution as a function of macro-climate in Ontario, Canada. J. Biogeogr. 1999;26(2): 315–328.
MeSH terms
LinkOut - more resources
Full Text Sources
Other Literature Sources
Molecular Biology Databases

