. 2017 Sep 7;21(3):332-348.e9.
doi: 10.1016/j.stem.2017.08.002.

MicroRNAs Induce a Permissive Chromatin Environment that Enables Neuronal Subtype-Specific Reprogramming of Adult Human Fibroblasts

Affiliations

MicroRNAs Induce a Permissive Chromatin Environment that Enables Neuronal Subtype-Specific Reprogramming of Adult Human Fibroblasts

Daniel G Abernathy et al. Cell Stem Cell. .

Abstract

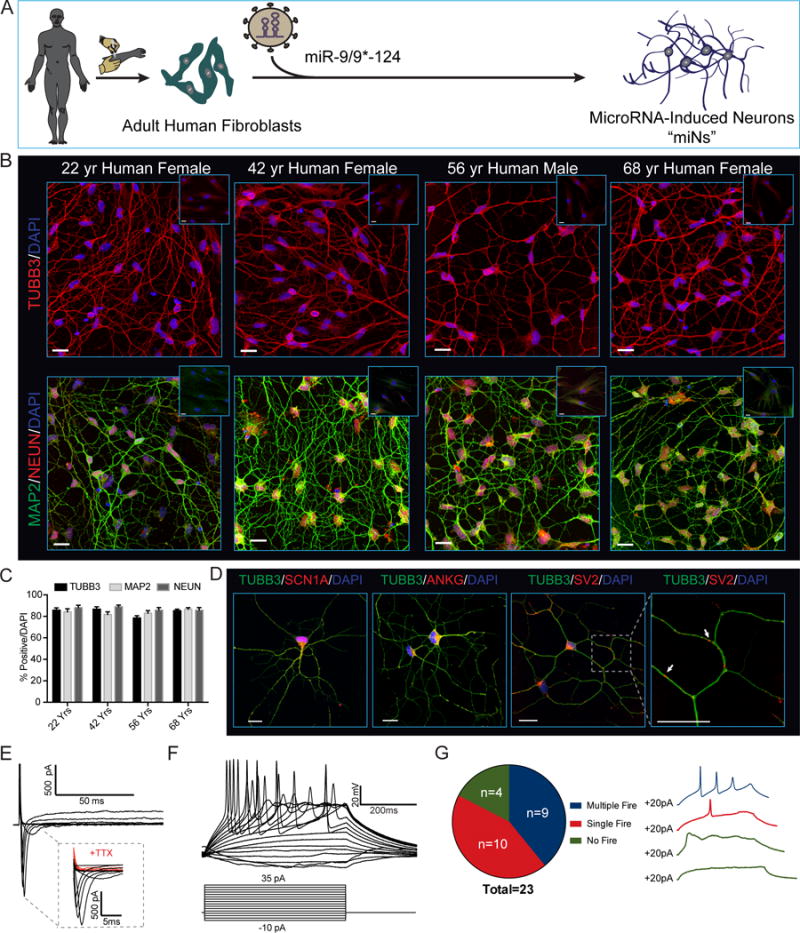
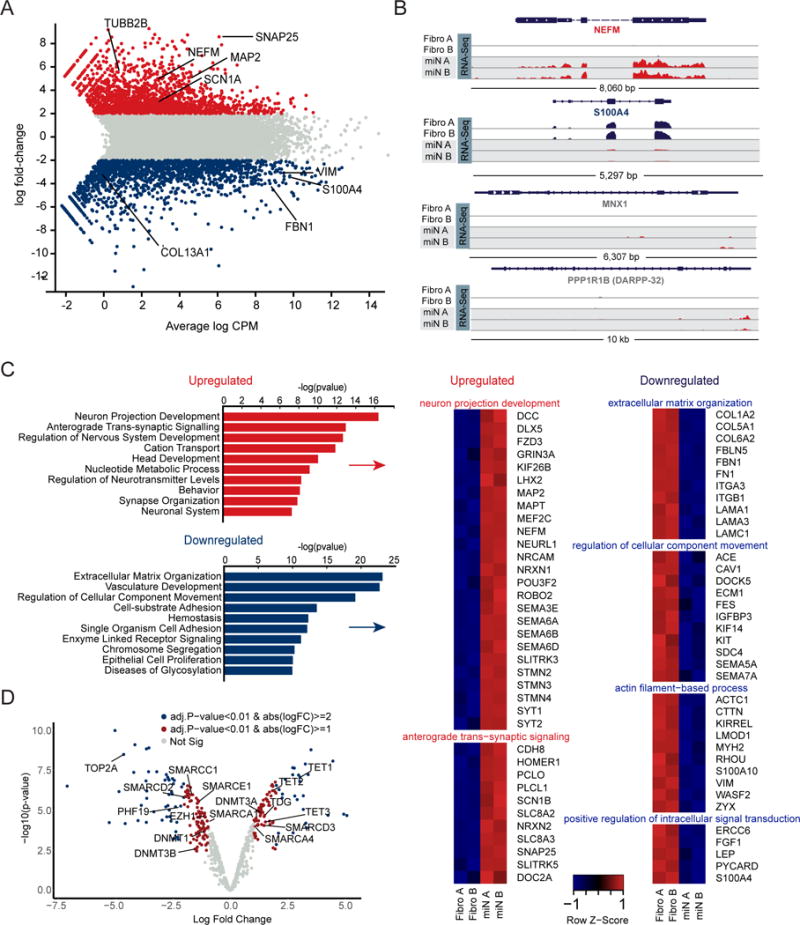
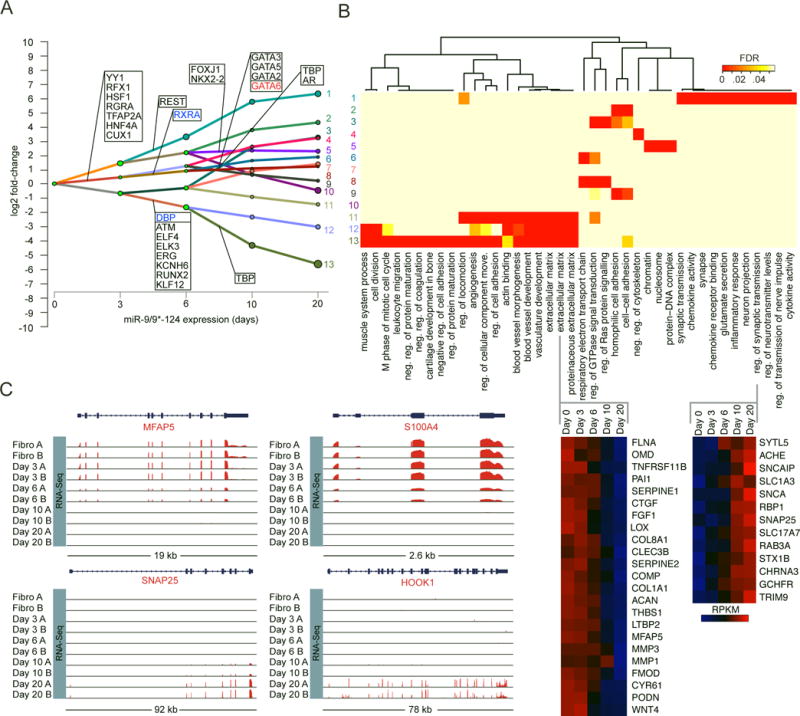
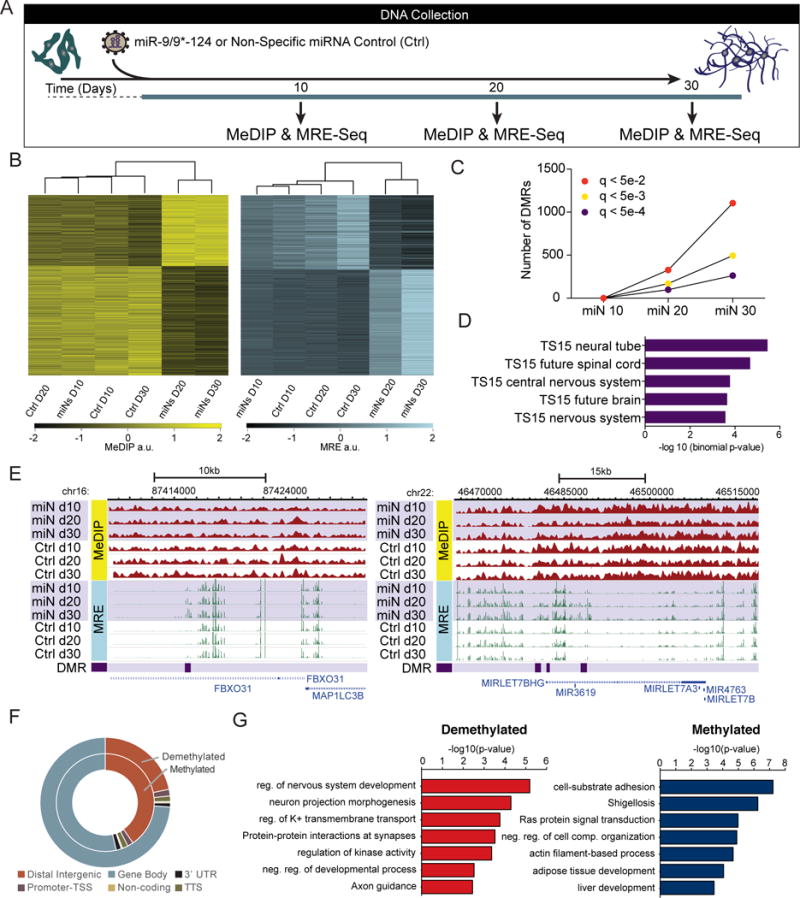
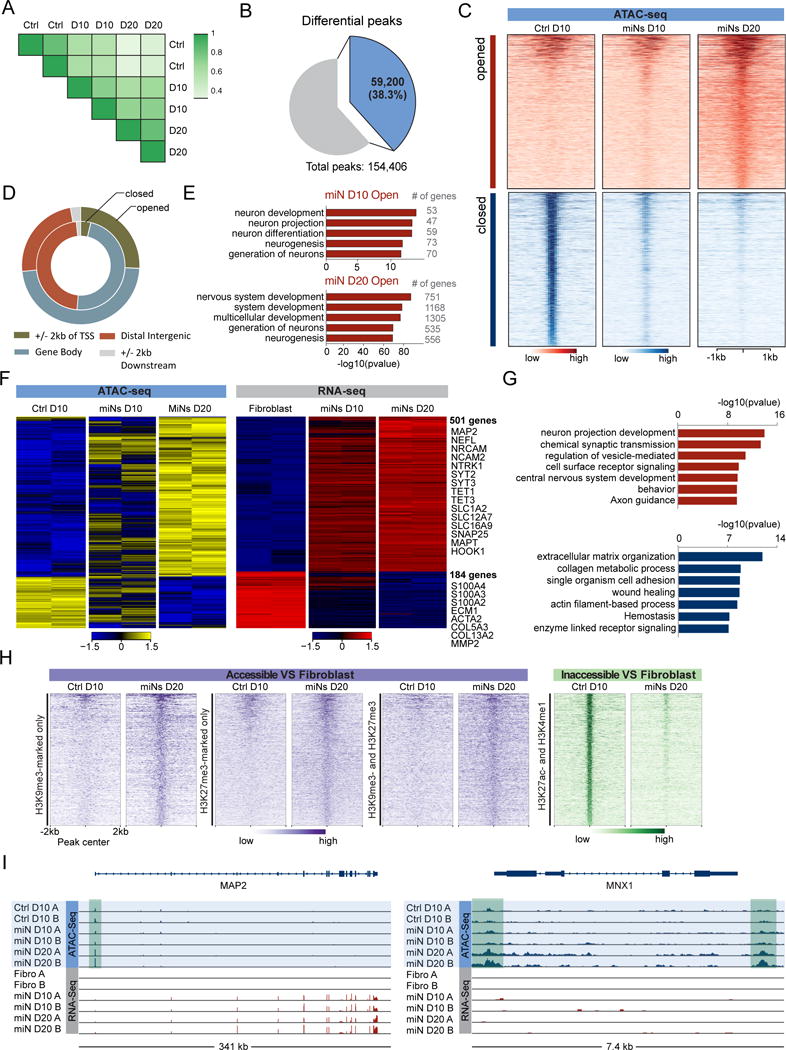
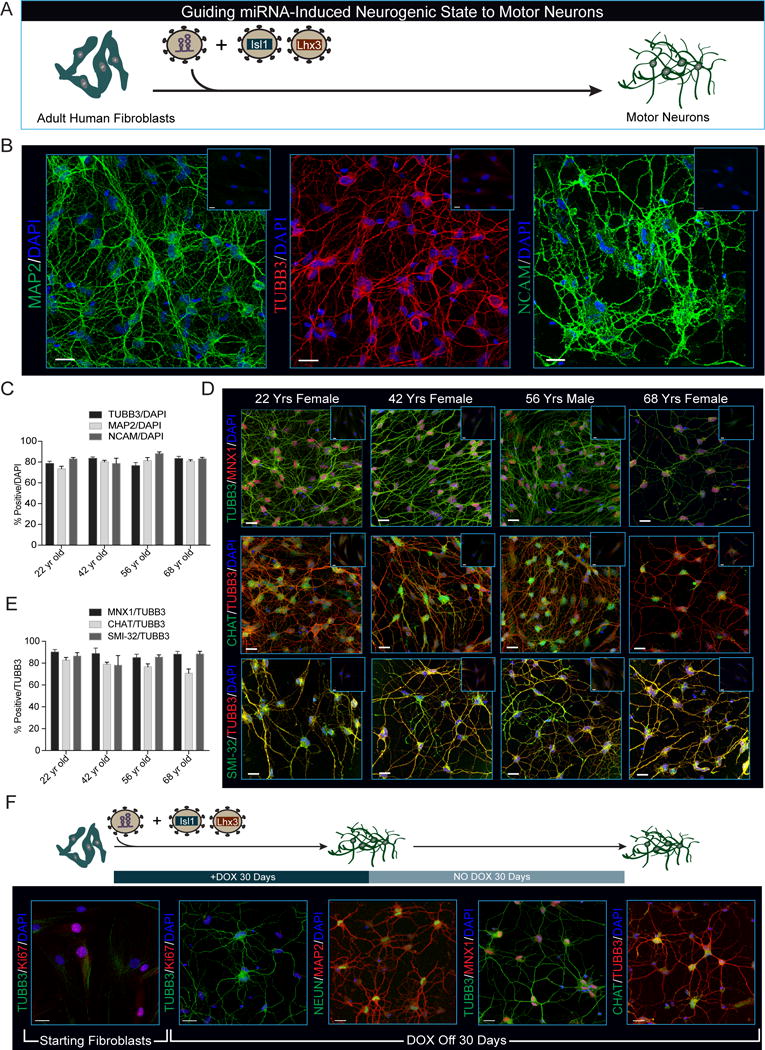
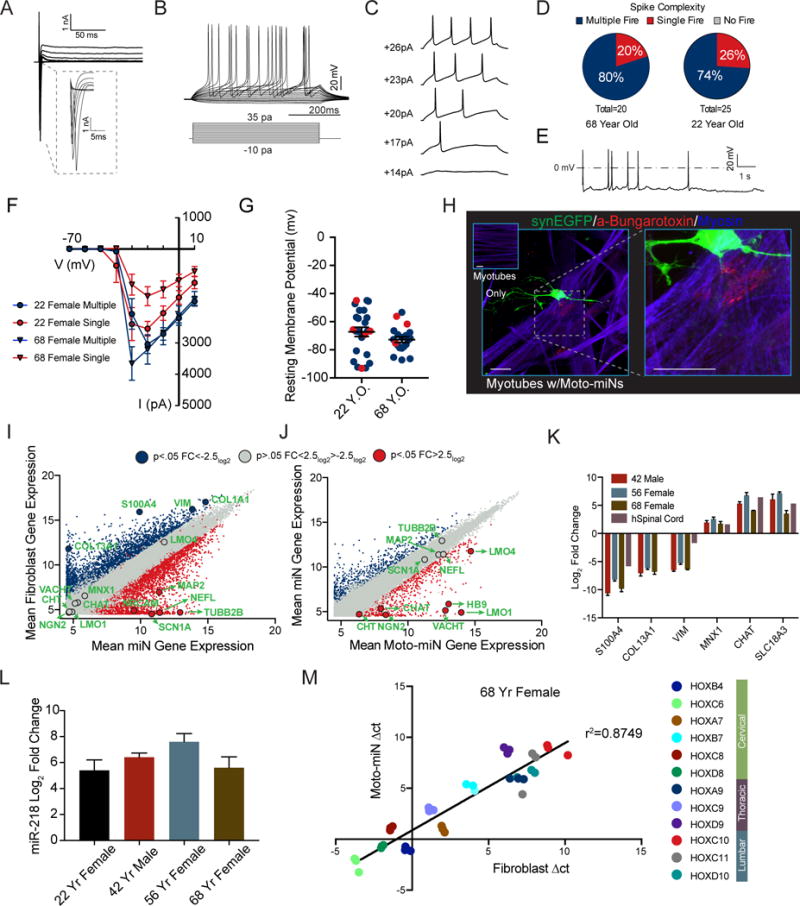
Directed reprogramming of human fibroblasts into fully differentiated neurons requires massive changes in epigenetic and transcriptional states. Induction of a chromatin environment permissive for acquiring neuronal subtype identity is therefore a major barrier to fate conversion. Here we show that the brain-enriched miRNAs miR-9/9 and miR-124 (miR-9/9-124) trigger reconfiguration of chromatin accessibility, DNA methylation, and mRNA expression to induce a default neuronal state. miR-9/9-124-induced neurons (miNs) are functionally excitable and uncommitted toward specific subtypes but possess open chromatin at neuronal subtype-specific loci, suggesting that such identity can be imparted by additional lineage-specific transcription factors. Consistently, we show that ISL1 and LHX3 selectively drive conversion to a highly homogeneous population of human spinal cord motor neurons. This study shows that modular synergism between miRNAs and neuronal subtype-specific transcription factors can drive lineage-specific neuronal reprogramming, providing a general platform for high-efficiency generation of distinct subtypes of human neurons.

Keywords: DNA methylation; cell fate; chromatin accessibility; chromatin remodeling; direct reprogramming; epigenetics; human neurons; microRNA; motor neurons; neurogenesis.


Conflict of interest statement

These authors contributed equally to this work

Figures

Figure 1
Figure 1. Direct Conversion of Young and Old Primary Adult Human Fibroblasts into Neurons via miRNA Overexpression
(A) Experimental scheme for miR-9/9*-124 mediated direct neuronal conversion. (B) Adult human fibroblasts ectopically expressing miR-9/9*-124 for 35 days immunostained for the pan-neuronal markers TUBB3, MAP2 and NEUN. Insets represent starting fibroblasts co-stained as negative controls. Scale bars = 20μm. (C) Quantification of TUBB3, MAP2 and NEUN positive cells over total number of cells (DAPI). For TUBB3 and MAP2, only cells with processes at least three times the length of the soma were counted. For NEUN, only cells with proper nuclear localization were counted. Data are represented as mean ± SEM. 22 Yr Female n = 238 cells, 42 Yr Female, n = 100 cells, 56 Yr Male n = 171 cells, and 68 Yr Female n = 216. (D) Converted neurons display hallmark sodium channel (SCN1A), axonal initial segment (ANKG) (left) and synaptic vesicle (SV2) (right) staining patterns. Scale bars = 20μm. (E) Representative traces of TTX-sensitive inward and potassium whole-cell currents. (F) Repetitive AP waveforms in response to 500 ms current injections recorded from converted neurons in monoculture. (G) Summary of AP firing patterns observed in 23 neurons recorded in current-clamp mode (left) and representative waveforms within each firing pattern recorded (right). See also Figure S1.
Figure 2
Figure 2. Gene Expression Profiling Reveals Pan-Neuronal Identity Induced by miRNAs Alone
(A) Genome wide expression analysis of miNs and starting fibroblasts by RNA-seq at day 30 of reprogramming. Plot shows the relationship between average gene expression (logCPM) and log fold-change of miNs compared to fibroblasts. A selection of pan-neuronal and fibroblast-specific genes are highlighted in black text. Blue = fold change < −2 log2 p < 0.01 (more abundant in fibroblasts), grey = fold change > −2 log2 < 2 log2 p > 0.01, and red = fold change > 2 log2 p < 0.01 (more abundant in miNs). FDR < 0.01. (B) Representative genome browser snapshots demonstrating increased expression for a pan-neuronal gene (NEFM), loss of fibroblast marker gene expression (S100A4), and absence of neuronal subtype marker gene expression (MNX1, motor neuron marker; DARPP-32, medium spiny neuron marker). (C) Gene ontology (GO) terms associated with genes upregulated in miNs (red) and GO terms associated with genes downregulated in miNs (blue). Right, examples of genes that fall within top GO categories listed. (D) Volcano plot representing chromatin modifier genes differentially expressed between fibroblasts and miNs. Blue dot, abs(logFC) > 2 and p < 0.01, red dot, abs(logFC) > 1 and p < 0.01, grey dot, no significant difference. See also Figure S2.
Figure 3
Figure 3. Time Series Transcriptome Analysis Reveals Early Dynamic Gene Expression Changes Followed by a Stable Transcriptome Switch
(A) Dynamic Regulatory Event Miner (DREM) analysis reveals multiple paths of co-regulated genes emerge over time (days). Genes shown in each rectangle represent predicted transcription factors that may underlie the transcriptome changes detected. (B) GO terms enriched in each path (top) and heat maps of genes within the extracellular matrix and regulation of synaptic transmission terms (bottom). Z-score normalized RPKM. (C) Representative genome browser snapshots demonstrating the time-dependent loss of fibroblast gene expression (top), emergence of pan-neuronal marker gene expression, and synaptic component expression (bottom).
Figure 4
Figure 4. MiR-9/9*-124 Alter DNA Methylation at Neuronal Loci
(A) Schematic of sample collection during miR-9/9*-124-mediated neuronal reprogramming for DNA methylation studies. Human fibroblasts were transduced with virus expressing miR-9/9*-124 or a non-specific (NS) control (Ctrl) virus at day 0. Samples were collected at day 10, day 20, and day 30. (B) Biclustering analysis of DMRs. Heatmaps based on MeDIP-seq RPKM (left) and MRE-seq RPKM (right) showing overlapping DMRs at days 20 and day 30. (C) Quantification of DMRs at multiple q-value cutoffs (q < 5e-2 in red; q < 5e-3 in yellow; q < 5e-4 in purple) across all time points: miN 10 (miN day 10 vs. Ctrl day 10), miN 20 (miN day 20 vs. Ctrl day 20), and miN 30 (miN day 30 vs. Ctrl day 30). (D) Tissue development enrichment of top overlapping DMRs at day 20 and day 30 show neuronal tissue terms at TS15 (~E9/10 in mouse development). (E) WashU Epigenome Browser screenshots of two DMRs: FBXO31 (left) and MIRLET7BHG (right) loci are shown with MeDIP-seq tracks (red; top), MRE-seq tracks (green; middle), and DMR positions (purple; bottom). (F) Genomic distribution of differentially methylated and demethylated regions. (G) Functional enrichment of top demethylated and upregulated (red; left) or methylated and downregulated (blue; right) DMRs overlapping at day 20 and day 30 compared with RNA-seq at day 30.
Figure 5
Figure 5. MiR-9/9*-124 Globally Changes Chromatin Accessibility
(A) Two-dimensional correlation plot of samples. Pearson’s correlation coefficient: 0.90 for Ctrl D10; 0.83 for miNs D10 (D10); 0.90 for miNs D20 (D20). (B) Pie chart showing the proportion of differential peaks and total peaks. Differential peaks were obtained by combining all significant peaks (Ctrl D10 vs miNs D10, miNs D10 vs miNs D20). (C) Heatmaps showing signal intensity in opened and closed chromatin peaks across all time points. All opened and closed chromatin regions were ranked according to maximum intensity across all samples. (D) The genomic distribution of opened and closed chromatin regions. (E) Comparison of GO terms for genes with opened chromatin regions at promoters in miNs at day 10 and 20. (F) Heatmaps showing gene expression levels for DEGs positively correlated with ATAC-seq signal intensities in their promoter regions. Signal intensity is based on normalized counts per million (CPM) values. Z-score normalized logCPM. (G) Top GO terms associated with DEGs that correlate with ATAC-seq signal intensity in promoter regions. Top (red): opened and upregulated genes. Bottom (blue): closed and downregulated genes. (H) Heatmaps showing ATAC signal intensities in the opened and closed chromatin regions in response to miR-9/9*-124, which overlapped with closed/heterochromatin and enhancer regions of fibroblasts. I) Integrated genomics viewer (IGV) screenshots showing two different examples of ATAC-seq and RNA-seq integration. An example of ATAC-seq and RNA-seq peaks within a pan-neuronal gene: MAP2 (left) and an example of ATAC-seq peaks (shaded green) within a subtype-specific locus without gene expression changes: MNX1 (right). See also Figures S3 and S4.
Figure 6
Figure 6. MiRNA-Induced Neuronal Competence Enables Motor Neuron Transcription Factors, ISL1 and LHX3, to Determine Motor Neuron Identity
(A) Schematic of neuronal induction paradigm using miR-9/9*-124 plus ISL1 and LHX3. (B) Representative immunohistochemistry for pan-neuronal markers in neurons generated from fibroblasts through 35 days of miR-9/9*-124, ISL1, and LHX3 co-expression. Fibroblasts were isolated from a 22-year-old female donor. Scale bars = 20μm. (C) Quantification of 4 independent primary human fibroblast samples from male and female donors stained with TUBB3, MAP2 and NCAM. Percentages represent total number of positive cells over all cells (DAPI) and are represented as mean ± SEM. Cells (N) analyzed: 22 yr old N=TUBB3 325, MAP2 219, NCAM 275; 42 yr old N=TUBB3 304, MAP2 236, NCAM 129; 56 yr old N=TUBB3 275, MAP2 279, NCAM 213; 68 yr old N=TUBB3 282, MAP2 234, NCAM 190. (D) Expression and correct localization of motor neuron markers in neurons converted by miR-9/9*-124 and ISL1/LHX3 as demonstrated by immunohistochemistry. MNX1, (top), CHAT (middle) and SMI-32 (bottom). Scale bars = 20μm. (E) Quantification of (D) represents the total percentage of MNX1, CHAT and SMI-32-positive cells over TUBB3-positive cells. Data are represented as mean ± SEM. Cells analyzed: 22 yr old N=MNX1 256, CHAT 256, SMI-32 113; 42 yr old N= MNX1 151, CHAT 151, SMI-32 283; 56 yr old N= MNX1 207, CHAT 207, SMI-32 174; 68 yr old N= MNX1 151, CHAT 151, SMI-32 96. (F) After 30 days of neuronal conversion by ectopic miR-9/9*-124 expression, Dox was removed and cells were cultured for an additional 30 days. Immunocytochemistry showing motor neurons produced by miR-9/9*-124 plus ISL1 and LHX3 (Moto-miNs) remain Ki-67 negative (2nd panel), retain expression and localization of the neuronal proteins TUBB3, NEUN, and MAP2 (2nd and 3rd panel), and express the motor neuron proteins MNX1 and CHAT (4th and 5th panel). Scale bars = 20μm. See also Figure S5.
Figure 7
Figure 7. Functional Properties and Gene Expression Profile of Moto-miNs
(A) Representative traces of inward sodium and outward potassium whole-cell currents. (B) Repetitive AP waveforms in response to 500 ms current injections recorded from Moto-miNs in monoculture. (C) Representative waveforms of APs with increasing current injections. (D) Summary of firing patterns observed in Moto-miNs converted from both old and young donors. 68 yr old 80% multiple (N=20), 22 yr old 74% multiple (N=25). (E) Spontaneous AP generation observed in a small percentage of Moto-miNs (3/20). (F) Combined plot of the current (I) - voltage (V) relationship for all Moto-miNs recorded. Data are represented as mean ± SEM. (G) Moto-miNs converted from both young and old donors are hyperpolarized, demonstrating mean resting membrane potentials of −67.2mV and −72.8mV, respectively. Data are represented as mean ± SEM. (H) Staining of Moto-miNs cultured with differentiated human myotubes. Moto-miNs were labeled with synapsin-EGFP via viral transduction and then plated onto human myotubes. Myotube only cultures did not have α-Bungarotoxin-594 (red) puncta (top left inset). Scale bar = 20μm. (I) Scatterplot comparing the mean gene expression between starting fibroblasts from a 22-year-old donor (y-axis) and miNs generated from the same individual (x-axis). Plot highlights a selection of pan-neuronal and fibroblast-specific genes in green text. Blue = log2FC < −2.5 and p < 0.05, (more abundant in fibroblasts) grey = log2FC > −2.5 and < 2.5 p > 0.05 (no significant difference), and red = log2FC > 2.5 and p < 0.05 (more abundant in miNs). (J) Scatterplot comparing the mean gene expression between miNs from a 22-year-old donor (y-axis) and Moto-miNs generated from the same individual (x-axis). Plot highlights a selection of pan-neuronal and motor neuron-specific genes in green text. Blue = log2FC < −2.5 and p < 0.05, (more abundant in miNs) grey = log2FC > −2.5 and < 2.5 p > 0.05 (no significant difference), and red = log2FC > 2.5 and p < 0.05 (more abundant in Moto-miNs). (K) qRT-PCR validation of fibroblast and motor neuron-specific genes. Moto-miNs were analyzed by qRT-PCR 35 days post-transduction. Human spinal cord RNA served as a positive control (normalized to 42 yr fibroblasts, ΔΔct method). Data are represented as mean ± SEM. (L) Moto-miNs express the motor neuron specific miRNA, miR-218. RNA was isolated from fibroblasts and Moto-miNs 35 days post-transduction and analyzed by qRT-PCR. Data are represented as mean ± SEM. (M) Moto-miNs retain HOX gene expression pattern of donor fibroblasts as demonstrated by qRT-PCR. Δct method. Data represent Δct values for each biological replicate (3 separate Moto-miN conversions). See also Figure S6 and S7.

References

    1. Amin ND, Bai G, Klug JR, Bonanomi D, Pankratz MT, Gifford WD, Hinckley CA, Sternfeld MJ, Driscoll SP, Dominguez B, et al. Loss of motoneuron-specific microRNA-218 causes systemic neuromuscular failure. Science. 2015;350:1525–1529. - PMC - PubMed
    1. Anders S, Pyl PT, Huber W. HTSeq–a Python framework to work with high-throughput sequencing data. Bioinformatics. 2015;31:166–169. - PMC - PubMed
    1. Boudreau RL, Jiang P, Gilmore BL, Spengler RM, Tirabassi R, Nelson JA, Ross CA, Xing Y, Davidson BL. Transcriptome-wide discovery of microRNA binding sites in human brain. Neuron. 2014;81:294–305. - PMC - PubMed
    1. Cantone I, Fisher AG. Epigenetic programming and reprogramming during development. Nat Struct Mol Biol. 2013;20:282–289. - PubMed
    1. Chi SW, Zang JB, Mele A, Darnell RB. Argonaute HITS-CLIP decodes microRNA-mRNA interaction maps. Nature. 2009;460:479–486. - PMC - PubMed

Publication types

MeSH terms