. 2017 Sep 7;170(6):1096-1108.e13.
doi: 10.1016/j.cell.2017.08.004.

NF-κB c-Rel Is Crucial for the Regulatory T Cell Immune Checkpoint in Cancer

Affiliations

NF-κB c-Rel Is Crucial for the Regulatory T Cell Immune Checkpoint in Cancer

Yenkel Grinberg-Bleyer et al. Cell. .

Abstract

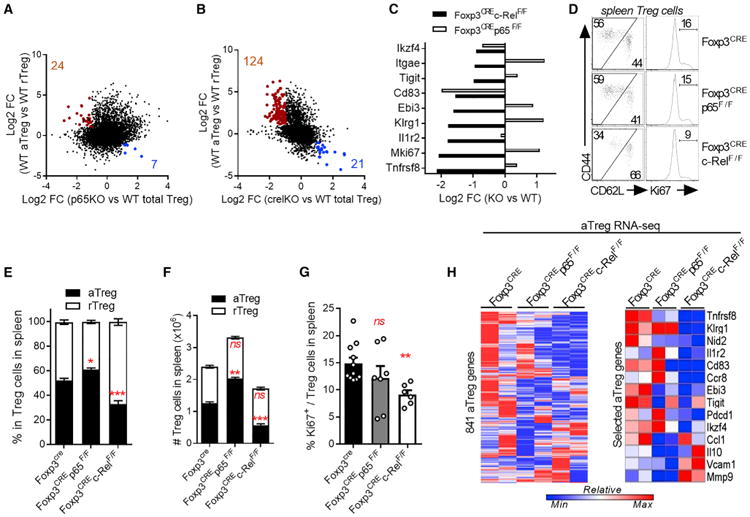
Regulatory T cells (Tregs) play a pivotal role in the inhibition of anti-tumor immune responses. Understanding the mechanisms governing Treg homeostasis may therefore be important for development of effective tumor immunotherapy. We have recently demonstrated a key role for the canonical nuclear factor κB (NF-κB) subunits, p65 and c-Rel, in Treg identity and function. In this report, we show that NF-κB c-Rel ablation specifically impairs the generation and maintenance of the activated Treg (aTreg) subset, which is known to be enriched at sites of tumors. Using mouse models, we demonstrate that melanoma growth is drastically reduced in mice lacking c-Rel, but not p65, in Tregs. Moreover, chemical inhibition of c-Rel function delayed melanoma growth by impairing aTreg-mediated immunosuppression and potentiated the effects of anti-PD-1 immunotherapy. Our studies therefore establish inhibition of NF-κB c-Rel as a viable therapeutic approach for enhancing checkpoint-targeting immunotherapy protocols.

Keywords: NF-κB; cancer; immunotherapy; regulatory T cells.


Figures

Figure 1
Figure 1. NF-κB c-Rel Regulates the Activated-Treg Differentiation and Gene Expression
(A–C) CD62Llow CD44high aTreg and CD62Lhigh CD44low rTreg were sorted from Foxp3CRE-YFP (WT) mice and submitted to RNA-seq analysis. Gene expression was compared to that in stimulated total Foxp3crep65F/F (p65KO) and Foxp3crec-RelF/F (c-RelKO) Treg (Oh et al., 2017). (A and B) Gene expression changes in WT aTreg versus WT rTreg were plotted against those in p65KO versus WT total Tregs (A) and c-RelKO versus WT total Tregs (B). Numbers and colored dots indicate genes upregulated in aTreg while downregulated in KO Treg (red) and downregulated in aTreg while upregulated in KO Treg (blue) (fold change >2, p < 0.01). (C) Expression of selected aTreg genes. (D) Representative FACS profiles in spleen Tregs from 5- to 7-week-old Foxp3cre, Foxp3crep65F/F, and Foxp3crec-RelF/F mice. (E and F) Cumulative % (E) and absolute numbers (F) of rTreg and aTreg in spleen Tregs. (G) Cumulative % of Ki67+ in spleen Tregs. (H) RNA-seq analysis of aTregs sorted from Foxp3cre, Foxp3crep65F/F, and Foxp3crec-RelF/F. Left heatmap shows expression of all 841 aTreg genes (fold change >2, p < 0.01 in WT aTreg versus WT rTreg) in each genotype. Right heatmap shows expression of selected aTreg genes. All RNA-seq data come from 2 independent experiments. FACS data is shown as mean ± SEM of 3 experiments with >6 mice/group. *p < 0.05, **p < 0.01, **p < 0.001; ns, non-significant. See also Figure S1.
Figure 2
Figure 2. c-Rel Expression in Tregs Restricts Anti-tumor Immune Responses
Five- to 7-week-old Foxp3cre, Foxp3crep65F/F, and Foxp3crec-RelF/F were transplanted subcutaneously with B16F1 cells. (A) Tumor growth over time. Numbers indicate the number of mice with detectable tumors at the end of the experiment. (B–H) Flow cytometry analysis 16 days after tumor challenge, with (B–D, G, and H) or without (E–G) PMA-ionomycin re-stimulation. (B) Numbers of T cells among 106 live cells. (C) CD4/CD8 T cells ratio. (D) Percent of IFN-γ+ in gated CD4+Foxp3 (CD4) and CD8+ (CD8) live T cells. (E) Representative FACS profiles in TILs. Numbers indicate % in gate. (F) Percent of Foxp3+ cells among CD4+ T cells. (G and H) Percent of Helios+ and IFN-γ+ among Tregs in TILs. (I–K) Splenocytes were stained immediately (I and J) or after PMA-ionomycin re-stimulation, 4 days after tumor challenge. Proportion of Ki67+ (I), CD44high (J), and TNFhighIFN-γ+ (K) cells is shown. (L) Mice were transplanted as in (A) and were injected at D0 and D3 with anti-CD8 or IgG isotype control. Tumor growth over time is shown. All data are represented as mean ± SEM of at least 3 experiments. *p < 0.05, **p < 0.01; n.s., non-significant. See also Figure S2.
Figure 3
Figure 3. Chemical c-Rel Inhibition Impairs Treg Identity
(A and B) CD4+GFP+ Tregs were sorted form Foxp3eGFP spleens and stimulated for 16 hr with anti-CD3/CD28 and mIL-2 in the presence of 500 μg/mL PTXF or H20. (A) Western Blot on total cell lysates and cumulative expression of c-Rel and RelA across 3 experiments. (B) Representative FACS profiles in gated live CD4+ cells. (C) Tregs sorted from Foxp3RFP mice were infected with GFP or c-Rel-GFP-encoding retroviruses and treated with PTXF or H2O as in (A). Data is shown as MFI relative to the GFP+H2O sample. (D) Tregs sorted from Foxp3cre (WT) and Foxp3crec-RelF/F (c-RelKO) were treated as in (A) and analyzed by FACS. Data is shown as MFI relative to the WT+H2O sample. (E–H) CD4+YFP+Tregs sorted from Foxp3cre (WT) and Foxp3crec-RelF/F were activated as in (B) and submitted to RNA-seq analysis. (E) Heatmap of differentially expressed genes (changed in at least one condition, using a fold-change cut-off >2 and a p value < 0.05 when compared to the WT+H2O samples). Gene expression in normalized for each row. (F) Expression of selected genes in each condition. (G) RNA-seq datasets were analyzed for signature enrichment using the C7 GSEA Collection (ImmunoSigDB). The proportion of unique and overlapping signatures (p value < 0.05) is shown. (H) Gene expression in WT aTreg versus WT rTreg (see Figure 1) was plotted against that in PTXF-treated Tregs versus H20-treated Tregs. Numbers and colored dots indicate genes upregulated in aTreg while downregulated in PTXF Treg (red) and downregulated in aTreg while upregulated in PTXF-Treg (blue) (fold change >2, p < 0.01). (I–K) CD4+GFP+ Tregs were stimulated as in (B) and subsequently tested for in vitro suppression (I) and in vivo colitis assays (J and K). (I) Suppression of responder T cells proliferation. (J) Weight changes upon cell transfer, shown as % of the initial weight at D0. (K) Total colon length at D35 after transfer. In (A)–(D) and (I)–(K), data are shown as mean ± SEM and are cumulative of 3–4 experiments. In (E)–(H), RNA-seq data is from 2 independent experiments. *p < 0.05, **p < 0.01, ***p < 0.001; n.s., non-significant. See also Figure S3.
Figure 4
Figure 4. c-Rel Inhibition by PTXF Suppresses Melanoma Growth
(A–G) WT C57BL/6J mice were transplanted subcutaneously with B16F1 cells and treated from D– 1 to D7 with PTXF or PBS. (A) Tumor growth over time. Arrows indicate the days of PTXF or PBS injection. (B–F) TILs were restimulated with PMA and ionomycin 16 days after tumor inoculation. (B) Cumulative numbers of T cells among 106 live cells. (C) CD4/CD8 T cells ratio. (D) Representative expression in CD8+ T cells (left) and cumulative % (right) of IFN-γ in T cells. (E) Percent of Foxp3+Tregs in CD4+T cells. (F) Percent of IFN-γ+ in Tregs. (G) qPCR analysis of total tumor RNA at D16. (H) RAG1−/− mice were transplanted and treated as in (A). Tumor growth overtime is shown. (I) WT C57BL/6J mice were transplanted and treated as in (A) with or without anti-CD8 administration (blue arrows). (J) Foxp3cre and Foxp3crec-RelF/F were transplanted subcutaneously with 3 × 10⁵ B16F1 cells and treated as in (A). (K) WT C57BL/6J mice were transplanted subcutaneously with B16F1 cells and treated from D– 1 to D7 with IT-603 or vehicle (arrows). Data are represented as mean ± SEM of 3 experiments. *p < 0.05, ***p < 0.001. See also Figure S4.
Figure 5
Figure 5. PTXF and PD-1-Blockade Have Additive Inhibitory Effects on Growth of Established Melanoma
(A–G) WT C57BL/6J mice were transplanted subcutaneously with B16F1 cells and treated from D6 with PTXF or anti-PD-1 mAb or PBS. (A) Tumor growth over time. Red arrows, PTXF injections; black arrows, anti-PD-1 injections. (B–F) TILS were restimulated with PMA and ionomycin 16 days after tumor inoculation. (B) Cumulative numbers of T cells among 106 live cells. (C) CD4/CD8 T cells ratio. (D) Representative expression in CD8+ T cells (left) and cumulative % (right) of IFN-γ in T cells. (E) Percent of Foxp3+ Tregs in CD4+ T cells. (F) Percent of IFN-γ+ in Tregs. (G) qPCR analysis of total tumor RNA at D16. (H) Mice were treated as in (A) and were injected with anti-CD8 mAb or IgG at D7 and D9 (blue arrows). (I) Mice were treated as in (A) but with anti-PD-L1 mAb. (J) WT Balb/C mice were transplanted subcutaneously with CT-26 cells and treated from D6 with PTXF or anti-PD-1 mAb (100 μg) or PBS. (K) WT C57BL/6J mice were transplanted subcutaneously with B16F1 cells and treated from with IT-603, and/or anti-PD-1, or vehicle. Data are represented as mean ± SEM of 3 to 4 experiments. *p < 0.05, ***p < 0.001. See also Figure S5.

Comment in

References

    1. Algul H, Treiber M, Lesina M, Nakhai H, Saur D, Geisler F, Pfeifer A, Paxian S, Schmid RM. Pancreas-specific RelA/p65 truncation increases susceptibility of acini to inflammation-associated cell death following cerulein pancreatitis. J Clin Invest. 2007;117:1490–1501. - PMC - PubMed
    1. Baumgartner JM, Gonzalez R, Lewis KD, Robinson WA, Richter DA, Palmer BE, Wilson CC, McCarter MD. Increased survival from stage IV melanoma associated with fewer regulatory T Cells. J Surg Res. 2009;154:13–20. - PubMed
    1. Beg AA, Sha WC, Bronson RT, Ghosh S, Baltimore D. Embryonic lethality and liver degeneration in mice lacking the RelA component of NF-kappa B. Nature. 1995;376:167–170. - PubMed
    1. Bertrand A, Kostine M, Barnetche T, Truchetet ME, Schaeverbeke T. Immune related adverse events associated with anti-CTLA-4 antibodies: systematic review and meta-analysis. BMC Med. 2015;13:211. - PMC - PubMed
    1. Boissonnas A, Scholer-Dahirel A, Simon-Blancal V, Pace L, Valet F, Kissenpfennig A, Sparwasser T, Malissen B, Fetler L, Amigorena S. Foxp3+ T cells induce perforin-dependent dendritic cell death in tumor-draining lymph nodes. Immunity. 2010;32:266–278. - PubMed