. 2017 Sep 7;170(6):1184-1196.e24.
doi: 10.1016/j.cell.2017.08.015.

Combinatorial Signal Perception in the BMP Pathway

Affiliations

Combinatorial Signal Perception in the BMP Pathway

Yaron E Antebi et al. Cell. .

Abstract

The bone morphogenetic protein (BMP) signaling pathway comprises multiple ligands and receptors that interact promiscuously with one another and typically appear in combinations. This feature is often explained in terms of redundancy and regulatory flexibility, but it has remained unclear what signal-processing capabilities it provides. Here, we show that the BMP pathway processes multi-ligand inputs using a specific repertoire of computations, including ratiometric sensing, balance detection, and imbalance detection. These computations operate on the relative levels of different ligands and can arise directly from competitive receptor-ligand interactions. Furthermore, cells can select different computations to perform on the same ligand combination through expression of alternative sets of receptor variants. These results provide a direct signal-processing role for promiscuous receptor-ligand interactions and establish operational principles for quantitatively controlling cells with BMP ligands. Similar principles could apply to other promiscuous signaling pathways.

Keywords: BMP; SMAD; bone morphogenetic protein; multiplicity; promiscuity receptor-ligand interactions; signal perception; signal processing; signaling pathways.


Figures

Figure 1
Figure 1
Promiscuous receptor-ligand interactions can be analyzed in terms of multi-dimensional ligand and receptor spaces (schematic). (A) In the BMP signaling pathway, multiple ligand variants (blue, green) interact promiscuously with multiple distinct type I (orange, yellow)-type II (purple, pink) receptor heterodimers. Most ligands interact with multiple receptor complexes (arrows), but all active signaling complexes phosphorylate the same second messenger, Smad1/5/8. Phosphorylated Smad1/5/8, in complex with Smad4, activates endogenous targets (white) and a stably integrated fluorescent reporter gene (yellow). (B, C) Cellular environments and expression levels can be represented as points in multi-dimensional spaces. (B) Ligand concentration space represents the possible local environments of cells. Only 3 ligands are plotted for simplicity, but the full space includes dimensions for each ligand species. Zoomed circles indicate examples of two environments with distinct concentrations of ligands. (C) Receptor space represents the space of possible receptor expression profiles. Only 3 of 7 dimensions are shown. Two example cell types with distinct receptor expression profiles are indicated (circles). These representations provoke the questions of (D) how multiple ligands combine to determine pathway activity in a given cell type, and (E) how different cell types respond to the same ligand combination.
Figure 2
Figure 2
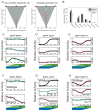
The BMP pathway perceives ligand combinations. (A) NMuMG reporter cells were exposed to 136 different combinatorial pairings of 15 homodimeric BMP ligands, as indicated. Color scale indicates mean fluorescence level at 24h, normalized by the uninduced population (‘relative activity’). (B) From the complete interaction matrix we extracted the individual response to each ligand (top row) and compared to the response to BMP4 (bottom row) and to mixtures of each ligand with BMP4 (middle row). By comparing each vertical triplet we see that specific ligands combine with BMP4 in different ways, both synergistically and antagonistically. (C–E) Measurements of full input-output response profiles for specific ligand pairs. (C) BMP4 and BMP9 combine to increase pathway activity in an additive fashion. (D) BMP4 and GDF5 combine in a ratiometric manner. (E) BMP4 and BMP10 showed an ‘imbalance detection’ response. For each plot in C–E, the dashed outline indicates a set of ligand concentrations varying from high concentration of one ligand (top left corner) to high concentration of the other ligand through intermediate states containing both ligands (e.g. top right). In C–E, the bottom row and left column correspond to an absence of the indicated ligand. (F–H) The responses along this contour are plotted for each ligand combination in C–E. These plots show that each pair shows a different dependence on ligand ratio. The logarithmic levels of each ligand are indicated schematically by the heights of the blue/green bars along the x-axis. Error bars indicate standard deviation calculated from at least 3 experiments. See also Figure S1 and S2 and Tables S1 and S4.
Figure 3
Figure 3
Combinatorial ligand response profiles emerge rapidly, persist for long times, and do not require co-factors. (A) phospho-Smad immunostaining reveals responses to BMP4-BMP9, BMP4-GDF5, and BMP4-BMP10 ligand combinations 20 minutes after ligand addition. (B) The dynamical response to mixtures of BMP4 and BMP10 is plotted over 70 hours after addition of the ligands. Data is normalized at each time point to the response of cells treated with BMP4 only. (C) Expressed BMP modifiers, identified in RNAseq (see Table S2) were depleted from NMuMG using siRNA. The relative expression levels of Fst, RGMb and Twsg1 were measured using qPCR in cells transfected with the corresponding siRNA (blue) normalized to their levels in cells transfected with a random siRNA (grey). (D–G) After depletion by random siRNA (D), Fst siRNA (E), RGMb siRNA (F) or Twsg1 siRNA (G), cells were treated with varying levels of BMP4 and the indicated ligand to assess their potential effect on combinatorial ligand response profiles. See also Figure S2 and S3 and Tables S2–4.
Figure 4
Figure 4
Mathematical modeling shows that combinatorial receptor-ligand interactions generate a specific repertoire of computational functions. (A) Schematic representation of ligands (top row), type A receptors (second row), type B receptors (third row), intermediate complexes (fourth row), and signaling complexes (fifth row), as described in the text. Only a subset of possible complexes is shown for simplicity. Colored lines highlight interactions involved in the formation of a single signaling complex, with corresponding parameters indicated. (B) Reactions (left) and corresponding steady-state equations (right) for the model. (C) With 2 ligands, and 2 variants of each receptor type, the model produces a variety of different signal processing behaviors. Each point represents the behavior of one randomly chosen parameter set. The x-axis represents the type and strength of interference between the ligands, from antagonism (negative values) to synergy (positive values). The y-axis represents the relative strength of the two ligands individually, as defined in Fig. S4B and Supplementary Text. Most parameter sets generate computations that fall within a triangular region, while some show more extreme phenotypes. The four archetypal computations, shown in D–G, are indicated by colored dots. (D–G) The four archetypal computations are shown (top) together with corresponding profiles showing pathway activity as a function of ligand ratio, as in Fig. 2F–H (bottom). See also Figure S4.
Figure 5
Figure 5
The four computational archetypes (cf. Fig. 4D–G) arise through the interplay between interaction affinities and complex activity. Representative parameter regimes producing each of the four archetypes are indicated schematically. Upper and middle arrow thicknesses indicate the affinities KijD and KijkT, respectively. Lower arrow thicknesses indicate the phosphorylation rate of each signaling complex εijk. (A) When two ligands are equivalent (similar arrow thicknesses), they combine additively. (B) When different ligands generate different levels of activity in complex with the same receptors (thin vs. thick bottom arrows), the less active ligand (blue) competitively inhibits the more active ligand (green), leading to ratiometric behavior. (C, D) Imbalance and balance detection regimes occur when affinity and activity parameters enable ligands to preferentially form less active (C), or more active (D), complexes, respectively. (E) For example, in the parameter regime corresponding to the imbalance detection, cells exposed only to a single ligand species (i.e. only blue or green ligands) produce a mixture of strong and weakly active complexes (left, right), but cells exposed to mixtures of the two ligands predominantly form weakly active complexes (middle), leading to the imbalance detection behavior. See also Figure S6.
Figure 6
Figure 6
Receptor expression controls computations. (A) Comparison of two simulated biochemical parameter sets (see Table S5 and Methods for parameter values). For each set, multiple receptor expression profiles are plotted (individual dots). Dot color indicates the most similar archetype (cf. Fig. 4C). For one parameter set (non-versatile, left), receptor expression only weakly affected computation. For the other parameter set (versatile, right), variation in receptor expression generates the full range of possible computations. (B) BMP receptor expression profiles for three cell lines. Bars indicate expression levels of each receptor (FPKM). Error bars represent standard deviation of three independent biological replicates. (C–E) Computation correlates with receptor expression pattern for three ligand pairs. Each column shows the response to the same pair of ligands for the indicated pair of ligands. Note the qualitative change in function between mESCs (bottom) and the other cell lines. Line colors refer to closest archetype (as in Fig. 4C). (F–H) Perturbing receptor expression level reprograms computations in NMuMG cells. Wild type cells (black points) were compared to cells with perturbed receptor expression (white points). Specific receptor perturbations are indicated next to each line, with up and down arrows indicating overexpression and siRNA, respectively. In C–H, error bars indicate standard deviation of at least 3 replicates. See also Figure S7 and Tables S3–5.
Figure 7
Figure 7
Schematic illustration of computational plasticity in the BMP signaling system (cf. Fig. 1D, E). Ligand combinations represent inputs to the pathway, which processes them through receptor-ligand interactions to control the expression level of downstream target genes. In this scheme, a given receptor configuration can perform different computations on different ligand combinations (e.g. additive and imbalance, top panel), whereas cells expressing different receptor profiles can perform distinct computations on the same combination of ligands (e.g. ratiometric and additive, lower panel).

Comment in

References

    1. Açil Y, Ghoniem AA, Wiltfang J, Gierloff M. Optimizing the osteogenic differentiation of human mesenchymal stromal cells by the synergistic action of growth factors. J Craniomaxillofac Surg. 2014;42:2002–2009. - PubMed
    1. Afgan E, Baker D, van den Beek M, Blankenberg D, Bouvier D, Čech M, Chilton J, Clements D, Coraor N, Eberhard C, et al. The Galaxy platform for accessible, reproducible and collaborative biomedical analyses: 2016 update. Nucleic Acids Res. 2016;44:W3–W10. - PMC - PubMed
    1. Afrakhte M, Morén A, Jossan S, Itoh S, Sampath K, Westermark B, Heldin CH, Heldin NE, ten Dijke P. Induction of Inhibitory Smad6 and Smad7 mRNA by TGF-β Family Members. Biochem Biophys Res Commun. 1998;249:505–511. - PubMed
    1. Atkinson DE. The energy charge of the adenylate pool as a regulatory parameter. Interaction with feedback modifiers Biochemistry. 1968;7:4030–4034. - PubMed
    1. Balemans W, Van Hul W. Extracellular regulation of BMP signaling in vertebrates: a cocktail of modulators. Dev Biol. 2002;250:231–250. - PubMed