

Assessing Exposure to Household Air Pollution: A Systematic Review and Pooled Analysis of Carbon Monoxide as a Surrogate Measure of Particulate Matter
- PMID: 28886596
- PMCID: PMC5744652
- DOI: 10.1289/EHP767
Assessing Exposure to Household Air Pollution: A Systematic Review and Pooled Analysis of Carbon Monoxide as a Surrogate Measure of Particulate Matter
Abstract
Background: Household air pollution from solid fuel burning is a leading contributor to disease burden globally. Fine particulate matter (PM2.5) is thought to be responsible for many of these health impacts. A co-pollutant, carbon monoxide (CO) has been widely used as a surrogate measure of PM2.5 in studies of household air pollution.
Objective: The goal was to evaluate the validity of exposure to CO as a surrogate of exposure to PM2.5 in studies of household air pollution and the consistency of the PM2.5-CO relationship across different study settings and conditions.
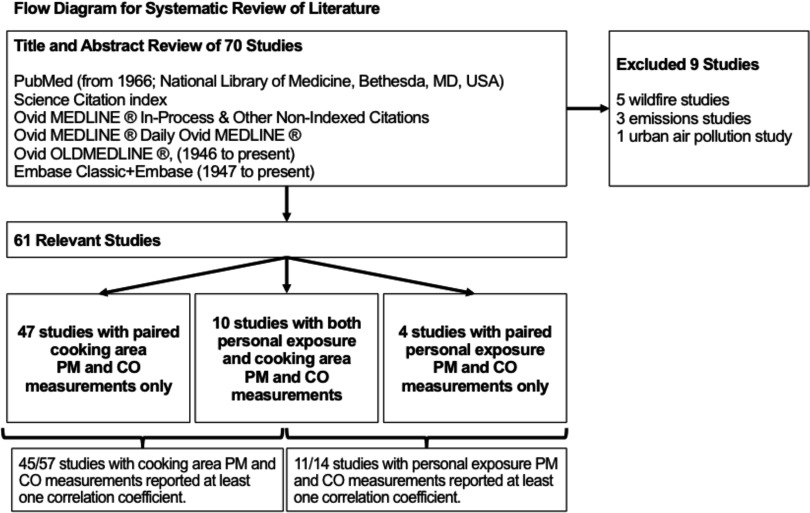
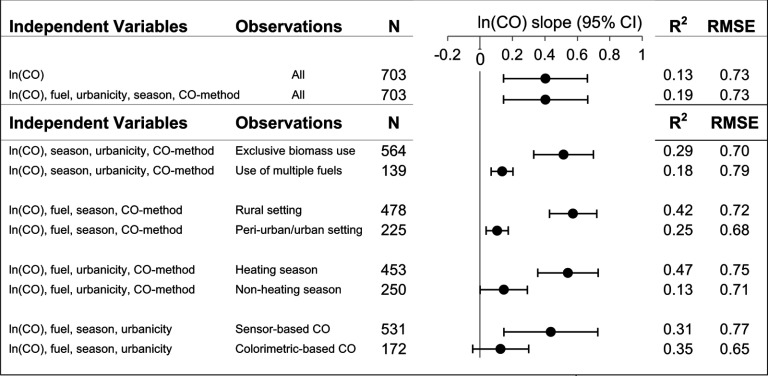
Methods: We conducted a systematic review of studies with exposure and/or cooking area PM2.5 and CO measurements and assembled 2,048 PM2.5 and CO measurements from a subset of studies (18 cooking area studies and 9 personal exposure studies) retained in the systematic review. We conducted pooled multivariate analyses of PM2.5-CO associations, evaluating fuels, urbanicity, season, study, and CO methods as covariates and effect modifiers.
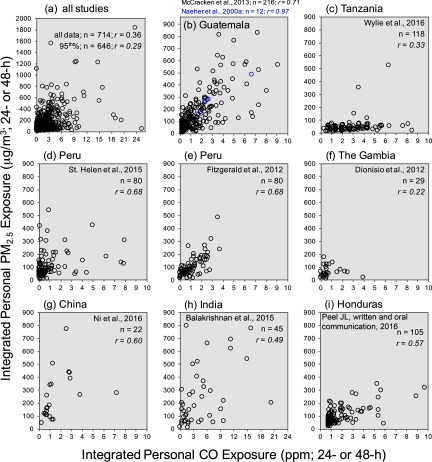
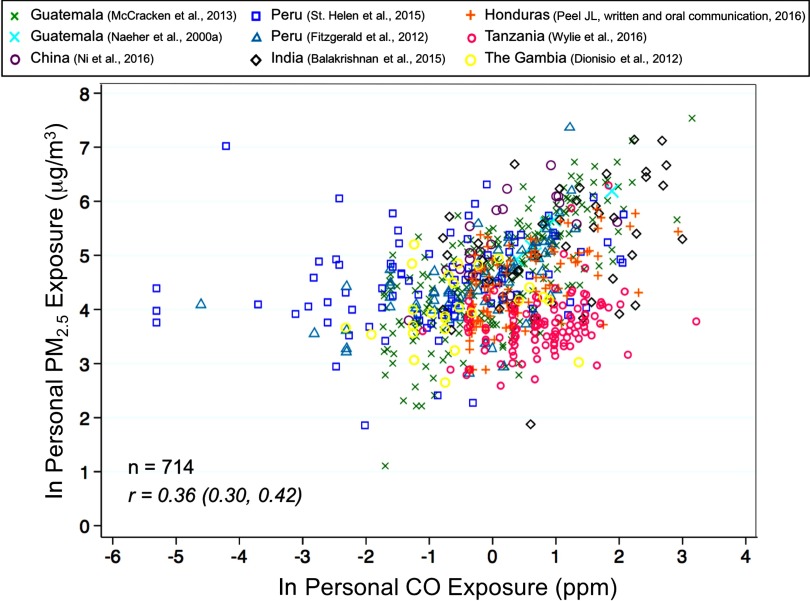
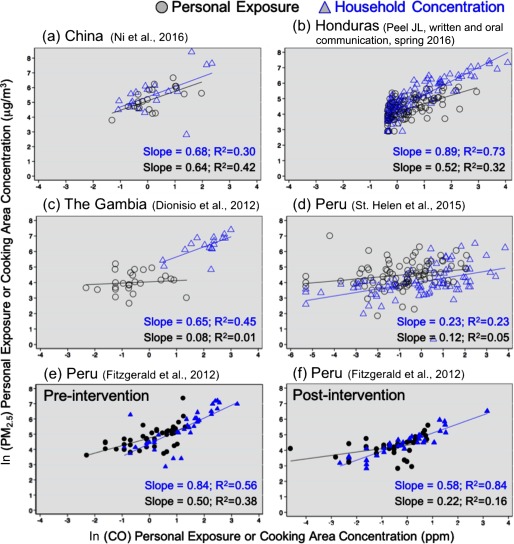
Results: We retained 61 of 70 studies for review, representing 27 countries. Reported PM2.5-CO correlations (r) were lower for personal exposure (range: 0.22-0.97; median=0.57) than for cooking areas (range: 0.10-0.96; median=0.71). In the pooled analyses of personal exposure and cooking area concentrations, the variation in ln(CO) explained 13% and 48% of the variation in ln(PM2.5), respectively.
Conclusions: Our results suggest that exposure to CO is not a consistently valid surrogate measure of exposure to PM2.5. Studies measuring CO exposure as a surrogate measure of PM exposure should conduct local validation studies for different stove/fuel types and seasons. https://doi.org/10.1289/EHP767.
Figures
Similar articles
-
Real-life effectiveness of 'improved' stoves and clean fuels in reducing PM2.5 and CO: Systematic review and meta-analysis.Environ Int. 2017 Apr;101:7-18. doi: 10.1016/j.envint.2017.01.012. Epub 2017 Jan 28. Environ Int. 2017. PMID: 28285622
-
Effectiveness of interventions to reduce household air pollution and/or improve health in homes using solid fuel in low-and-middle income countries: A systematic review and meta-analysis.Environ Int. 2017 Jun;103:73-90. doi: 10.1016/j.envint.2017.03.010. Epub 2017 Mar 22. Environ Int. 2017. PMID: 28341576
-
Comparing human exposure to fine particulate matter in low and high-income countries: A systematic review of studies measuring personal PM2.5 exposure.Sci Total Environ. 2022 Aug 10;833:155207. doi: 10.1016/j.scitotenv.2022.155207. Epub 2022 Apr 11. Sci Total Environ. 2022. PMID: 35421472 Free PMC article.
-
Application of the navigation guide systematic review methodology to evaluate prenatal exposure to particulate matter air pollution and infant birth weight.Environ Int. 2021 Mar;148:106378. doi: 10.1016/j.envint.2021.106378. Epub 2021 Jan 25. Environ Int. 2021. PMID: 33508708 Free PMC article.
-
Impact of the Wood-Burning Justa Cookstove on Glycated Hemoglobin (HbA1c): A Stepped-Wedge Randomized Trial in Rural Honduras.Environ Health Perspect. 2025 May;133(5):57021. doi: 10.1289/EHP15095. Epub 2025 May 27. Environ Health Perspect. 2025. PMID: 40300153 Free PMC article. Clinical Trial.
Cited by
-
Personal Exposure to PM2.5 Black Carbon and Aerosol Oxidative Potential using an Automated Microenvironmental Aerosol Sampler (AMAS).Environ Sci Technol. 2018 Oct 2;52(19):11267-11275. doi: 10.1021/acs.est.8b02992. Epub 2018 Sep 21. Environ Sci Technol. 2018. PMID: 30200753 Free PMC article.
-
Exposure–Response Associations of Household Air Pollution and Buccal Cell Telomere Length in Women Using Biomass Stoves.Environ Health Perspect. 2019 Aug;127(8):87004. doi: 10.1289/EHP4041. Epub 2019 Aug 8. Environ Health Perspect. 2019. PMID: 31393791 Free PMC article.
-
Exposure to household air pollution from biomass cookstoves and self-reported symptoms among women in rural Honduras.Int J Environ Health Res. 2020 Apr;30(2):160-173. doi: 10.1080/09603123.2019.1579304. Epub 2019 Feb 13. Int J Environ Health Res. 2020. PMID: 30760020 Free PMC article.
-
Mutagenicity- and pollutant-emission factors of pellet-fueled gasifier cookstoves: Comparison with other combustion sources.Sci Total Environ. 2020 Oct 15;739:139488. doi: 10.1016/j.scitotenv.2020.139488. Epub 2020 May 20. Sci Total Environ. 2020. PMID: 32526531 Free PMC article.
-
Monitoring and modeling of household air quality related to use of different Cookfuels in Paraguay.Indoor Air. 2019 Mar;29(2):252-262. doi: 10.1111/ina.12513. Epub 2019 Jan 30. Indoor Air. 2019. PMID: 30339298 Free PMC article.
References
-
- Alnes LW, Mestl HE, Berger J, Zhang H, Wang S, Dong Z, et al. 2014. Indoor PM and CO concentrations in rural Guizhou, China. Energy Sustain Dev 21:51–59, 10.1016/j.esd.2014.05.004. - DOI
-
- Armstrong BG. 2004. Exposure measurement error: consequences and design issues. Exposure Assessment in Occupational and Environmental Epidemiology. Nieuwenhuijsen MJ, ed. New York, NY:Oxford University Press.
Publication types
MeSH terms
Substances
Grants and funding
LinkOut - more resources
Full Text Sources
Other Literature Sources
Medical
