

Comparative transcriptome analysis of cotton fiber development of Upland cotton (Gossypium hirsutum) and Chromosome Segment Substitution Lines from G. hirsutum × G. barbadense
- PMID: 28886694
- PMCID: PMC5591532
- DOI: 10.1186/s12864-017-4077-8
Comparative transcriptome analysis of cotton fiber development of Upland cotton (Gossypium hirsutum) and Chromosome Segment Substitution Lines from G. hirsutum × G. barbadense
Abstract
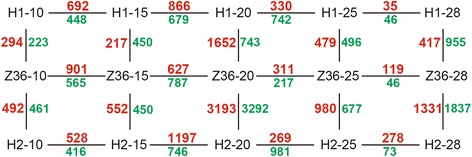
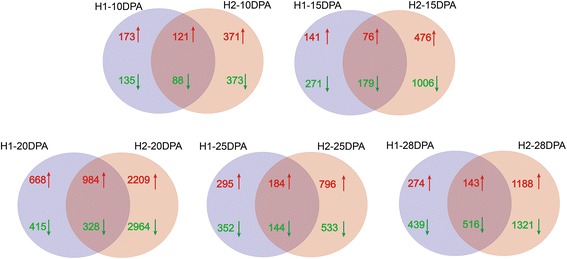
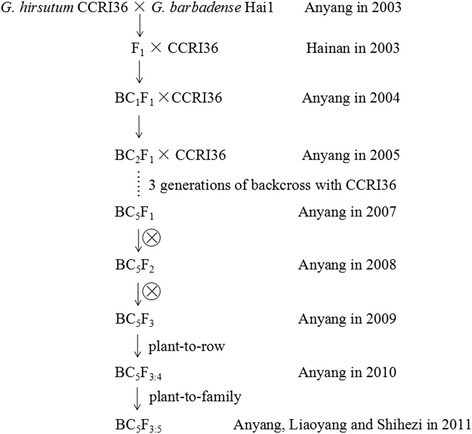
Background: How to develop new cotton varieties possessing high yield traits of Upland cotton and superior fiber quality traits of Sea Island cotton remains a key task for cotton breeders and researchers. While multiple attempts bring in little significant progresses, the development of Chromosome Segment Substitution Lines (CSSLs) from Gossypium barbadense in G. hirsutum background provided ideal materials for aforementioned breeding purposes in upland cotton improvement. Based on the excellent fiber performance and relatively clear chromosome substitution segments information identified by Simple Sequence Repeat (SSR) markers, two CSSLs, MBI9915 and MBI9749, together with the recurrent parent CCRI36 were chosen to conduct transcriptome sequencing during the development stages of fiber elongation and Secondary Cell Wall (SCW) synthesis (from 10DPA and 28DPA), aiming at revealing the mechanism of fiber development and the potential contribution of chromosome substitution segments from Sea Island cotton to fiber development of Upland cotton.
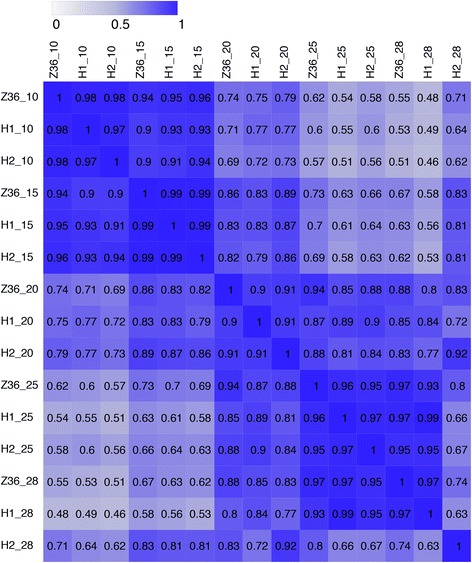
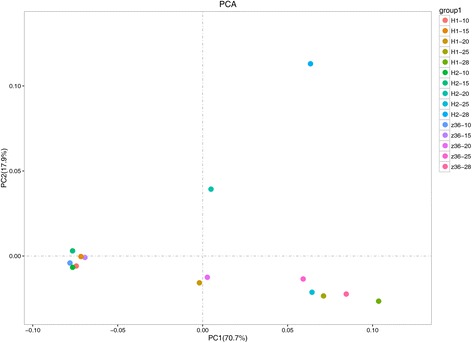
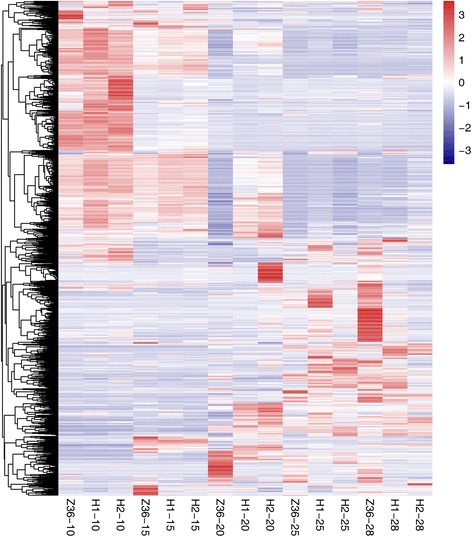
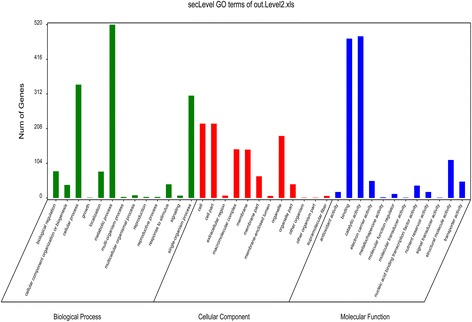
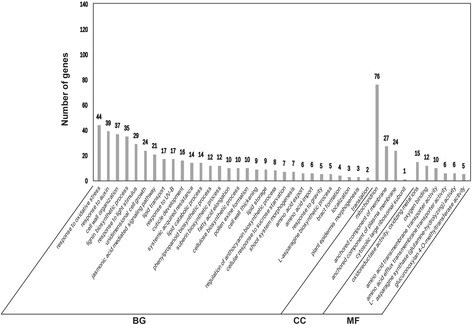
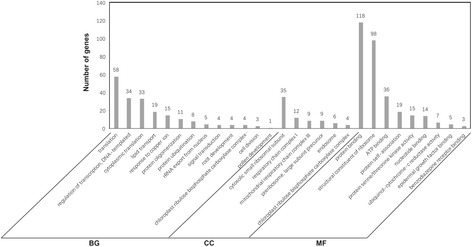
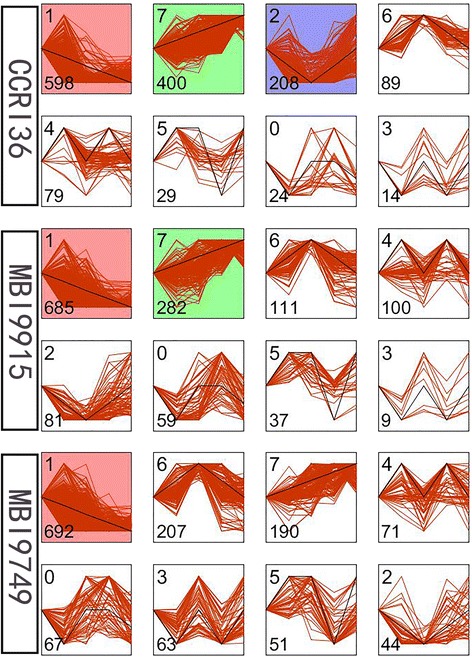
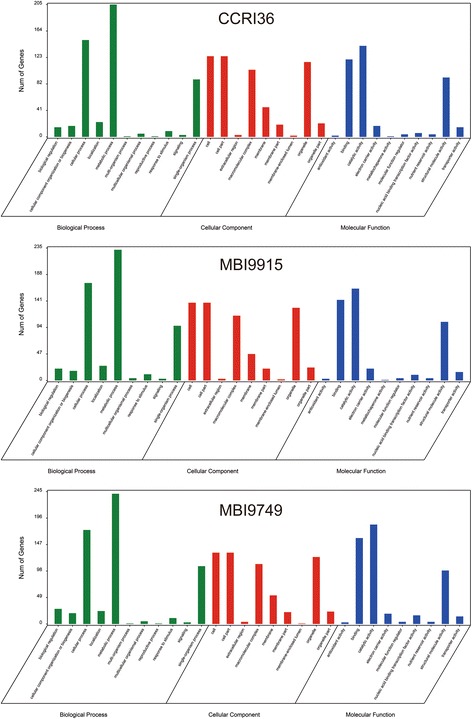
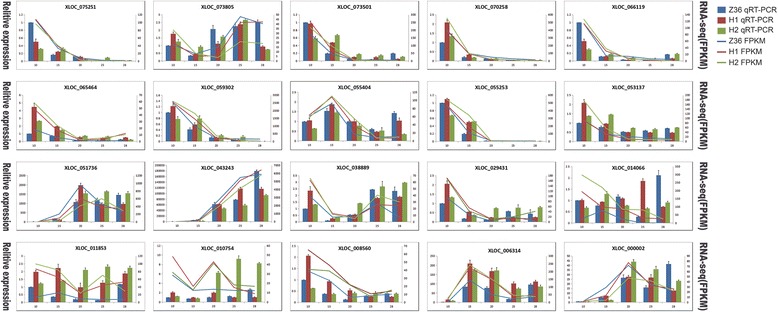
Results: In total, 15 RNA-seq libraries were constructed and sequenced separately, generating 705.433 million clean reads with mean GC content of 45.13% and average Q30 of 90.26%. Through multiple comparisons between libraries, 1801 differentially expressed genes (DEGs) were identified, of which the 902 up-regulated DEGs were mainly involved in cell wall organization and response to oxidative stress and auxin, while the 898 down-regulated ones participated in translation, regulation of transcription, DNA-templated and cytoplasmic translation based on GO annotation and KEGG enrichment analysis. Subsequently, STEM software was performed to explicate the temporal expression pattern of DEGs. Two peroxidases and four flavonoid pathway-related genes were identified in the "oxidation-reduction process", which could play a role in fiber development and quality formation. Finally, the reliability of RNA-seq data was validated by quantitative real-time PCR of randomly selected 20 genes.
Conclusions: The present report focuses on the similarities and differences of transcriptome profiles between the two CSSLs and the recurrent parent CCRI36 and provides novel insights into the molecular mechanism of fiber development, and into further exploration of the feasible contribution of G. barbadense substitution segments to fiber quality formation, which will lay solid foundation for simultaneously improving fiber yield and quality of upland cotton through CSSLs.
Keywords: Chromosome Segment Substitution Lines; Fiber development; G. hirsutum × G. barbadense; Gossypium hirsutum; Transcriptome analysis.
Conflict of interest statement
Ethics approval and consent to participate
Not applicable.
Consent for publication
Not applicable.
Competing interests
The authors declare that they have no competing interests.
Publisher’s Note
Springer Nature remains neutral with regard to jurisdictional claims in published maps and institutional affiliations.
Figures
References
-
- Wendel J, Albert VA. Phylogenetics of the cotton genus (Gossypium): characteristic weighted parsimony analysis of chloroplast-DNA restriction site data and its systematic and biogeographic implications. Syst Bot. 1992;17:115–143. doi: 10.2307/2419069. - DOI
-
- Wendl JF, Brubaker C, Alvarez I, Cronn R, Stewart JM. Evolution and natural history of the cotton genus. In: Paterson AH, editor. Genetics and genomics of cotton. New York: Springer; 2009. pp. 3–22.
-
- Zhang JF, Percy RG, McCarty JC., Jr Introgression genetics and breeding between Upland and Pima cotton: a review. Euphytica. 2014;198:1–12. doi: 10.1007/s10681-014-1094-4. - DOI
-
- Wang P, Ding YZ, Lu QX, Guo WZ, Zhang TZ. Development of Gossypium barbadense chromosome segment substitution lines in the genetic standard line TM-1 of Gossypium hirsutum. Chin Sci Bull. 2008;53(10):1512–1517.
Publication types
MeSH terms
LinkOut - more resources
Full Text Sources
Other Literature Sources
Miscellaneous
