. 2017 Nov 6;216(11):3535-3549.
doi: 10.1083/jcb.201612160. Epub 2017 Sep 8.

Silencing of retrotransposons by SETDB1 inhibits the interferon response in acute myeloid leukemia

Affiliations

Silencing of retrotransposons by SETDB1 inhibits the interferon response in acute myeloid leukemia

Trinna L Cuellar et al. J Cell Biol. .

Abstract

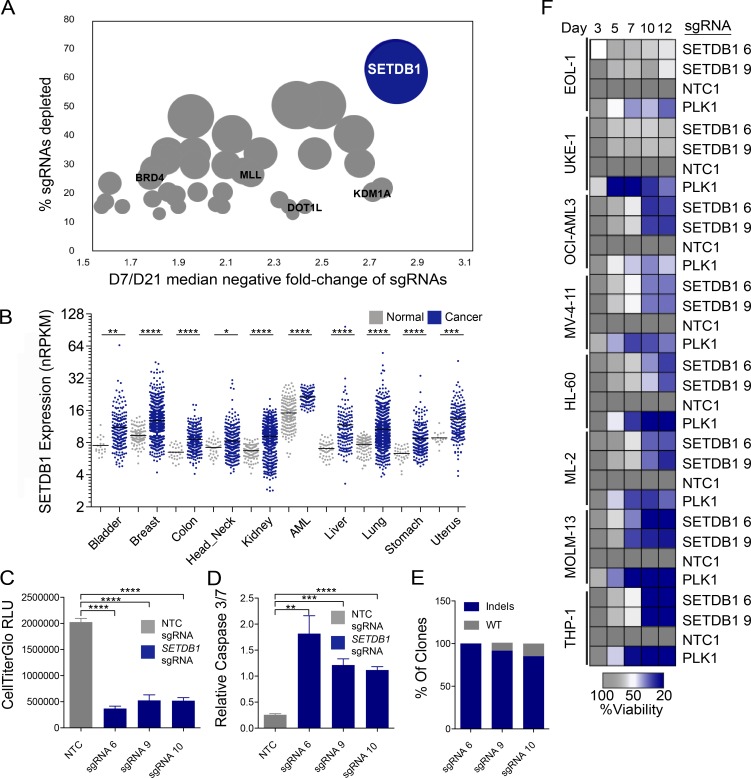
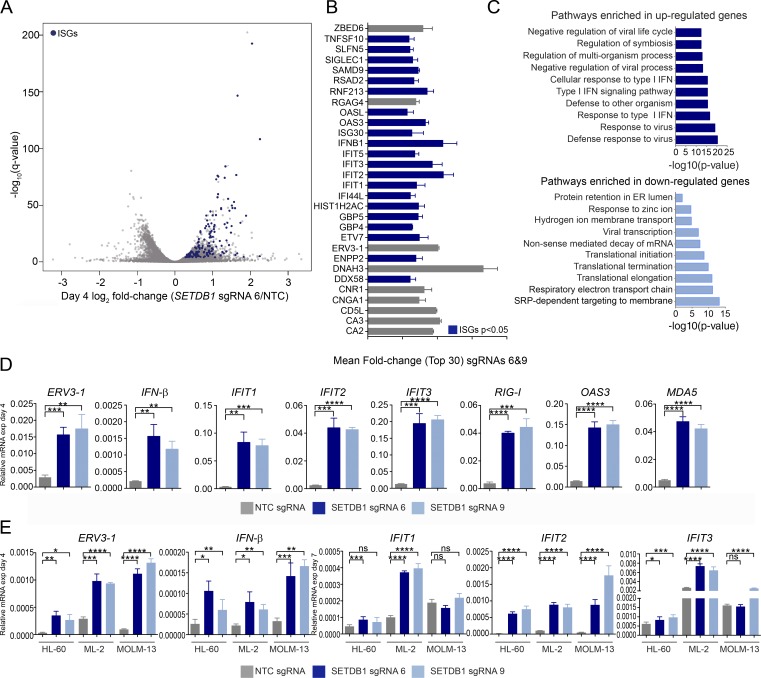
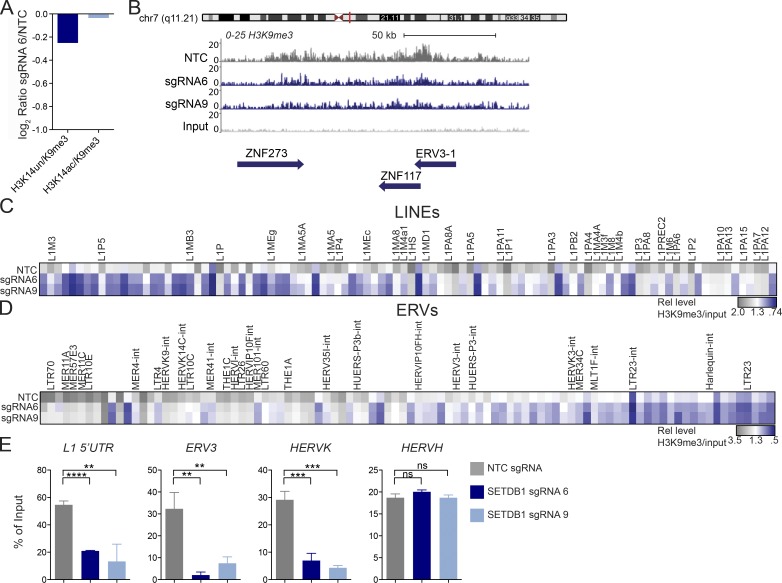
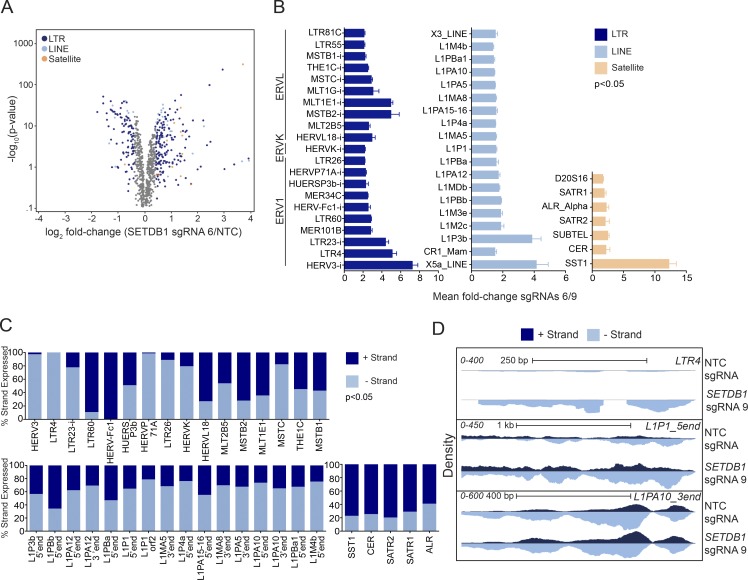
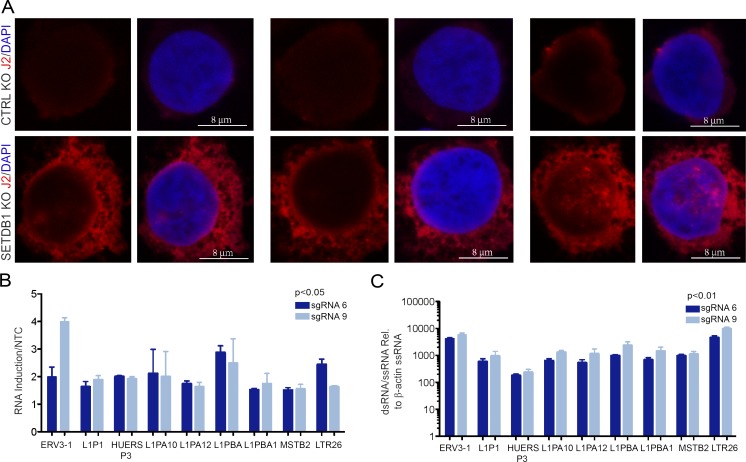
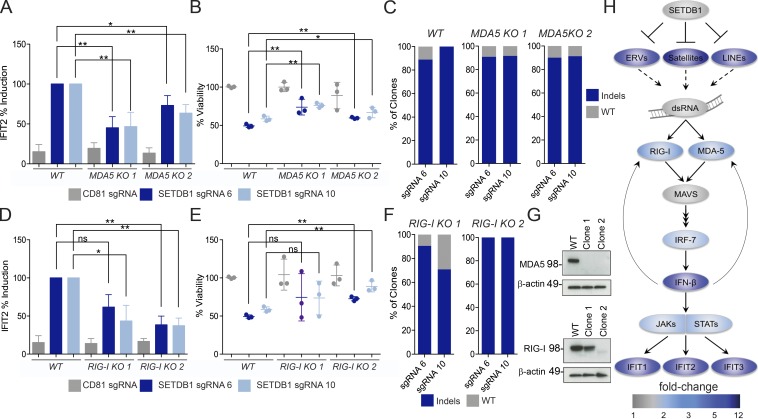
A propensity for rewiring genetic and epigenetic regulatory networks, thus enabling sustained cell proliferation, suppression of apoptosis, and the ability to evade the immune system, is vital to cancer cell propagation. An increased understanding of how this is achieved is critical for identifying or improving therapeutic interventions. In this study, using acute myeloid leukemia (AML) human cell lines and a custom CRISPR/Cas9 screening platform, we identify the H3K9 methyltransferase SETDB1 as a novel, negative regulator of innate immunity. SETDB1 is overexpressed in many cancers, and loss of this gene in AML cells triggers desilencing of retrotransposable elements that leads to the production of double-stranded RNAs (dsRNAs). This is coincident with induction of a type I interferon response and apoptosis through the dsRNA-sensing pathway. Collectively, our findings establish a unique gene regulatory axis that cancer cells can exploit to circumvent the immune system.


Figures

Figure 1.
Figure 1.
A CRISPR/Cas9 genetic screen identifies SETDB1 as a critical regulator of the leukemic cell survival that is overexpressed in many cancers. (A) Median negative fold changes of sgRNA abundance at day 21 versus day 7, ranked by percentage of sgRNAs depleted for each gene in THP-1–Cas9 cells. n = 3 biological replicates for the day 7 reference and n = 2 biological replicates for day 21. The size of each circle corresponds to the fraction of depleted sgRNAs/target. Select regulators of AML cell growth are highlighted in black text. Significant fold changes were calculated with DESeq2. (B) Compiled data from TCGA RNA-seq. SETDB1-normalized RPKM (reads per kilobase of transcript per million mapped reads) values in cancer and normal tissues. Student’s t tests were performed. (C and D) Viability and Caspase 3/7 levels, as measured by Caspase-Glo, in THP-1–Cas9 cells after 7 d of treatment with three different SETDB1-specific sgRNAs or an NTC sgRNA. Mean relative light units (RLU) are shown. n = 3 experiments. Error bars represent standard deviation. Student’s t tests were performed. (B–D) *, P < 0.05; **, P < 0.01; ***, P < 0.001; ****, P ≤ 0.0001. (E) Indel frequency at listed sgRNA target sites. Genomic DNA derived from THP-1–Cas9 cells 7 d after sgRNA infection. (F) Arrayed target validation screen in eight Cas9-stable AML lines. Mean viability at each day is shown. Screen performed in duplicate.
Figure 2.
Figure 2.
Loss of SETDB1 leads to the induction of viral response genes. (A) Volcano plot of RNA-seq gene expression changes in THP-1–Cas9 cells after 4 d of treatment with representative SETDB1-specific sgRNA relative to NTC (DESeq2 log2 fold changes vs. significance −log10 [q-value], and n = 3 biological replicates). ISGs are highlighted in blue. (B) Bar plot of top 30 induced genes (ISGs are in blue) in THP-1–Cas9 cells after treatment with two SETDB1-specific sgRNAs (6 and 9) at day 4. Mean fold change was calculated using the fold changes for each SETDB1-specific sgRNA relative to NTC, and n = 3 biological replicates. (C) Panther gene ontology analysis shows most significantly enriched biological processes after SETDB1 disruption at day 4 (genes up-regulated/down-regulated ≥1.5-fold in both cells treated with SETDB1 sgRNAs 6 and 9 were used for the analysis). (D) Taqman qRT-PCR validation of RNA-seq data on day 4, showing relative expression of IFN-inducible transcripts after treatment with SETDB1 sgRNAs or an NTC control sgRNA. n = 3 experiments, and Student’s t tests were performed. (E) Taqman qRT-PCR data on day 4 showing relative expression of IFN-β and ERV3-1 as well as ISGs at day 7 after treatment of three different SETDB1 disruption-sensitive AML lines with SETDB1-specific or NTC sgRNAs. n = 3 experiment, and Student’s t tests were performed. Error bars represent standard deviation. (D and E) ns, not significant, P > 0.05; *, P < 0.05; **, P < 0.01; ***, P < 0.001; ****, P ≤ 0.0001.
Figure 3.
Figure 3.
Loss of SETDB1 leads to a modest reduction in H3K9me3. (A) Histone mass spectrometry analysis of H3K9me3 levels in THP-1–Cas9 cells after 6 d of treatment with SETDB1 sgRNA 6 or NTC (log2 ratios of sgRNA 6 over NTC are shown). (B) Density plot showing H3K9me3 levels over the ERV3-1/ZNF117 locus as well as the neighboring ZNF273 gene (levels of H3K9me3 in THP-1–Cas9 cells are shown after 6 d of treatment with control NTC sgRNA or distinct SETDB1-specific sgRNAs. Y axis is 0–25 and region shown is ∼150 kb. (C) Low input nChIP-seq heat map showing LINE-1 elements with a ≥1.2-fold reduction in H3K9me3 after 6 d of treatment with sgRNA 6, sgRNA 9, or NTC. For each sgRNA, the relative enrichment = fractional H3K9me3 reads/nonimmunoprecipitated chromatin reads (input/background). Highlighted genes were up-regulated at days 4, 7, or both days in SETDB1 mutant RNA-seq datasets. (D) As in C; heat map showing ERV elements with a ≥1.2-fold reduction in H3K9me3 after 6 d of treatment with sgRNA 6, sgRNA, 9 or NTC. (E) ChIP-PCR validation of ChIP-seq data from day 6, showing percentage of input of cells treated with NTC or SETDB1-specific sgRNAs for L1 LINE 5′UTR, HERV-K-rev, ERV3-1-exon, and HERV-H-pregag (n = 3 experiments. Student’s t tests were performed). All error bars represent standard deviation. ns, not significant, P > 0.05; **, P < 0.01; ***, P < 0.001; ****, P < 0.0001.
Figure 4.
Figure 4.
Loss of SETDB1 leads to the induction of TEs. (A) An RNA-seq volcano plot depicting expression changes of TEs in THP-1–Cas9 cells at day 7 after treatment with a representative SETDB1-specific sgRNA versus NTC (n = 3 for all samples, EdgeR GLM log2 fold change). (B) Bar plots showing statistically significant (P < 0.05) EdgeR GLM fold changes of TEs in SETDB1 sgRNA–treated THP-1–Cas9 cells (mean fold change of sgRNAs 6 and 9) over NTC at day 7 (n = 3 biological replicates, and error bars represent standard deviation). (C) Bar plots derived from strand-specific RNA-seq of SETDB1 or NTC sgRNA–treated THP-1–Cas9 cells at day 7. Up-regulated TEs are shown as a percentage of reads derived from 5′ or 3′ transcribed products. In B and C, "i" denotes "internal." (D) Density plots showing an example of a unidirectionally transcribed TE (LTR4), a bidirectionally transcribed element (L1P1_5′end), and a second bidirectionally transcribed element in which only one strand is increased after treatment with an SETDB1-specific sgRNA for 7 d (L1PA10_3′end).
Figure 5.
Figure 5.
Loss of SETDB1 leads to the induction of dsRNAs. (A) Confocal microscopy images of representative THP-1–Cas9 cells 5 d after nucleofection with synthetic gRNAs targeting CD81 (negative control, top) or SETDB1 (target sequence 6, bottom). Cells were stained with J2 antibody to label dsRNA and DAPI to mark nuclei. (B) qRT-PCR validated expression of bidirectionally transcribed LINEs and ERVs in THP-1–Cas9 cells after 5 d of treatment with SETDB1 sgRNAs or an NTC control sgRNA (n = 3 biological replicates). (C) RNase protection assay showing expression of dsRNAs in THP-1–Cas9 cells after 5 d of treatment with synthetic SETDB1-specific gRNAs after digestion of total RNA with RNase A/T1. ssRNA, single-stranded RNA. Enrichments are relative to NTC control sgRNA (n = 3 biological replicates, and Student’s t tests were performed). Error bars represent standard deviation.
Figure 6.
Figure 6.
IFN response and cell death in SETDB1 mutant cells are dependent on the viral sensing machinery. (A) Induction of IFIT2 expression after SETDB1 disruption or control gene (CD81) disruption, in THP-1–Cas9 cells (WT) or two MDA5 KO THP-1–Cas9 clones. Total RNA was analyzed 5 d after nucleofection of cells with synthetic SETDB1 gRNAs or control gRNA targeting CD81. (B) Cell viability at day 5 after nucleofection for cells and conditions described in A. (C) Indel rate at noted target sites for THP-1–Cas9 cells for cells and conditions described in A. Genomic DNA analyzed at day 5 after nucleofection. (D) Induction of IFIT2 expression after targeting SETDB1 or control gene (CD81) disruption in THP-1–Cas9 cells (WT) or RIG-I hypomorphic (clone 1) and KO (clone 2) THP-1–Cas9 clones. Total RNA was analyzed 5 d after nucleofection of cells with synthetic SETDB1 gRNAs or control gRNA targeting CD81. (E) Cell viability at day 5 after nucleofection for cells and conditions described in D. (A, B, D, and E) n = 3 experiments, and Student’s t tests were performed. (F) Indel rate at noted target sites for THP-1–Cas9 cells for cells and conditions described in D. Genomic DNA analyzed at day 5 after nucleofection. (G) Western blot analysis of MDA5, RIG-I, and β-actin in THP-1–Cas9 WT or clonal lines after overnight stimulation with IFN-β. (H) Model of SETDB1 function, based on ingenuity analysis 4 RNA-seq data 4 d after SETDB1 disruption (as shown in Fig. 2), as well as incorporating TEs into map. Color bar denotes fold change compared with NTC-treated cells. All error bars represent standard deviation. (A, B, D, and E) ns, not significant, P > 0.05; *, P < 0.05; **, P < 0.01.

Comment in

References

    1. Aguirre A.J., Meyers R.M., Weir B.A., Vazquez F., Zhang C.Z., Ben-David U., Cook A., Ha G., Harrington W.F., Doshi M.B., et al. 2016. Genomic copy number dictates a gene-independent cell Response to CRISPR/Cas9 targeting. Cancer Discov. 6:914–929. 10.1158/2159-8290.CD-16-0154 - DOI - PMC - PubMed
    1. Anders S., Pyl P.T., and Huber W.. 2015. HTSeq--a Python framework to work with high-throughput sequencing data. Bioinformatics. 31:166–169. 10.1093/bioinformatics/btu638 - DOI - PMC - PubMed
    1. Brind’Amour J., Liu S., Hudson M., Chen C., Karimi M.M., and Lorincz M.C.. 2015. An ultra-low-input native ChIP-seq protocol for genome-wide profiling of rare cell populations. Nat. Commun. 6:6033. - PubMed
    1. Cherkasova A.P., and Selyatitskaya V.G.. 2013. Corticosteroid hormones and angiotensin-converting enzyme in the dynamics of chronic granulomatous inflammation. [In Russian]. Patol. Fiziol. Eksp. Ter. 2:26–31. - PubMed
    1. Chiappinelli K.B., Strissel P.L., Desrichard A., Li H., Henke C., Akman B., Hein A., Rote N.S., Cope L.M., Snyder A., et al. 2015. Inhibiting DNA methylation causes an interferon response in cancer via dsRNA including endogenous retroviruses. Cell. 162:974–986. (published erratum appears in Cell 2017. 169:361) 10.1016/j.cell.2015.07.011 - DOI - PMC - PubMed

MeSH terms