. 2017 Sep 8;7(1):11047.
doi: 10.1038/s41598-017-10369-z.

Sulfonolipids as novel metabolite markers of Alistipes and Odoribacter affected by high-fat diets

Affiliations

Sulfonolipids as novel metabolite markers of Alistipes and Odoribacter affected by high-fat diets

Alesia Walker et al. Sci Rep. .

Abstract

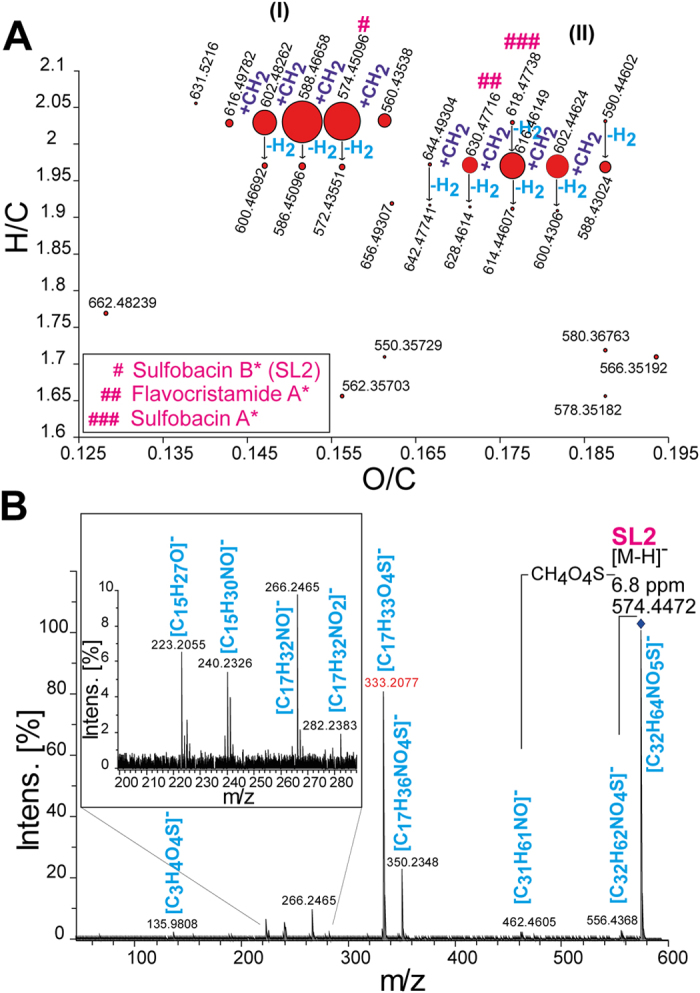
The gut microbiota generates a huge pool of unknown metabolites, and their identification and characterization is a key challenge in metabolomics. However, there are still gaps on the studies of gut microbiota and their chemical structures. In this investigation, an unusual class of bacterial sulfonolipids (SLs) is detected in mouse cecum, which was originally found in environmental microbes. We have performed a detailed molecular level characterization of this class of lipids by combining high-resolution mass spectrometry and liquid chromatography analysis. Eighteen SLs that differ in their capnoid and fatty acid chain compositions were identified. The SL called "sulfobacin B" was isolated, characterized, and was significantly increased in mice fed with high-fat diets. To reveal bacterial producers of SLs, metagenome analysis was acquired and only two bacterial genera, i.e., Alistipes and Odoribacter, were revealed to be responsible for their production. This knowledge enables explaining a part of the molecular complexity introduced by microbes to the mammalian gastrointestinal tract and can be used as chemotaxonomic evidence in gut microbiota.


Conflict of interest statement

The authors declare that they have no competing interests.

Figures

Figure 1
Figure 1
Screening of the putative sulfonolipids (SLs) in gastrointestinal tract (cecum) of mice. (A) Van Krevelen diagram of the SLs classes (I and II) as detected by ultrahigh-resolution FT-ICR-MS (insert stars reflect the putative annotation of the mass signals derived from ChemSpider database). (B) MS/MS spectrum of the SL2 and its corresponding fragment ions with their molecular formulas (blue color). Characteristic fragment ion of SL2 is highlighted in red.
Figure 2
Figure 2
High-fat diet alters SLs in cecum of C57BL/6N mice. (A) PCA displaying SAFF (green dots; n = 9), LARD (red dots, n = 10) and NC (blue dots; n = 7) diet fed mice. Data is derived by integrating peak areas of all SLs, taking parent-fragment ion information as described in Table S2. (B) PLS-DA of SAFF, LARD and NC samples, with their respective loadings plot of SLs (black dots), as shown in (C). (D) Individual box plots of each SL and their distribution in each group (Welch t-test; P-value < 0.05; *SAFF vs. NC; #LARD vs. NC).
Figure 3
Figure 3
K00639 is key gene to predict SLs producers by metagenomics. (A) Taxonomic distribution of bacterial sphingolipid biosynthesis genes K00639 and K00652 for SAFF mice (n = 6), that were elaborated by metagenomics. (B) LC peak of SL2, found in AFD (pink), APU (blue), ATI (dark green), OSP (green), ASH (light blue), FJO (brown) and CGL (black), respectively. (C) Radar diagram of the detected SLs in bacteria (number of detected SLs for each strain is indicated in blue). (D) Radar diagram of each SL and number of bacteria, in which each lipid was identified. (E) Ratios of SL1:1/SL2 and SL1:2/SL2 that are significantly altered between SAFF (black), LARD (red) and NC (blue) fed mice (Welch t-test; P-value < 0.05; *SAFF vs. NC; #LARD vs. NC). (F) Ratio analysis of SL1:1/SL2 (orange) and SL1:2/SL2 (blue), as well as their distribution in bacterial cultures of Alistipes strains (AFD, APU, ATI, ASH, AIN, AON, AOB and AIH), OSP, FJO, CGL and a pooled sample of cecal content extract (Pooled sample; n = 26).
Figure 4
Figure 4
Gut microbiota is essential to detect SLs in-vivo. (A) SLs are absent in germfree (GF, white; n = 7) mice, comparing SPF mice (magenta; n = 6) and mono-colonized mice with Alistipes sp. strain (CC-5826-WT-bac) (turquoise; n = 8). (B) Ratio comparison of SL1:1/SL2 and SL1:2/SL2. (Welch t-test; P-value < 0.05; #GF vs. SPF; *GF vs. Alistipes).

References

    1. Pruett ST, et al. Biodiversity of sphingoid bases (“sphingosines”) and related amino alcohols. J Lipid Res. 2008;49:1621–1639. doi: 10.1194/jlr.R800012-JLR200. - DOI - PMC - PubMed
    1. Wenk MR. The emerging field of lipidomics. Nature Reviews Drug Discovery. 2005;4:594–610. doi: 10.1038/nrd1776. - DOI - PubMed
    1. Merrill AH. Sphingolipid and Glycosphingolipid Metabolic Pathways in the Era of Sphingolipidomics. Chem Rev. 2011;111:6387–6422. doi: 10.1021/cr2002917. - DOI - PMC - PubMed
    1. White RH. Biosynthesis of the sulfonolipid 2-amino-3-hydroxy-15-methylhexadecane-1-sulfonic acid in the gliding bacterium Cytophaga johnsonae. J Bacteriol. 1984;159:42–46. - PMC - PubMed
    1. Takikawa H, Nozawa D, Kayo A. Muto, S.-e. & Mori, K. Synthesis of sphingosine relatives. Part 22. Synthesis of sulfobacin A, B and flavocristamide A, new sulfonolipids isolated from Chryseobacterium sp. Journal of the Chemical Society, Perkin Transactions. 1999;1:2467–2477. doi: 10.1039/a904258j. - DOI

Publication types

LinkOut - more resources