. 2017 Sep 8;7(1):11012.
doi: 10.1038/s41598-017-11490-9.

Identification of Purple Acid Phosphatases in Chickpea and Potential Roles of CaPAP7 in Seed Phytate Accumulation

Affiliations

Identification of Purple Acid Phosphatases in Chickpea and Potential Roles of CaPAP7 in Seed Phytate Accumulation

Jyoti Bhadouria et al. Sci Rep. .

Abstract

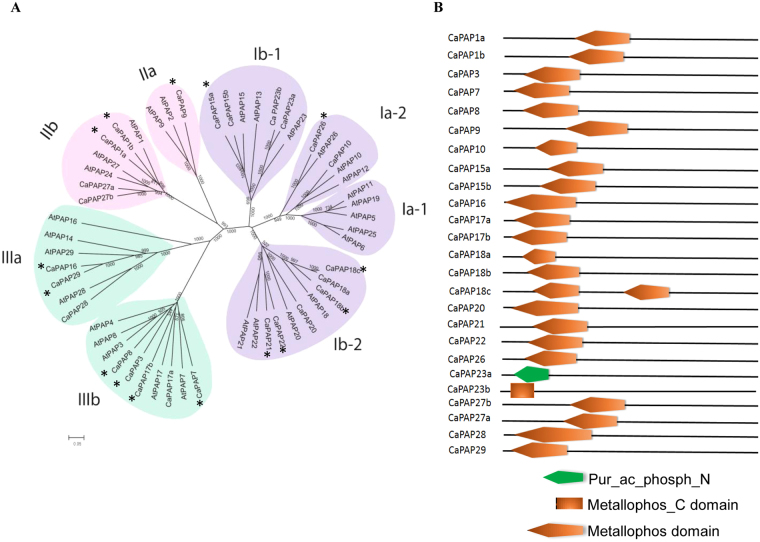
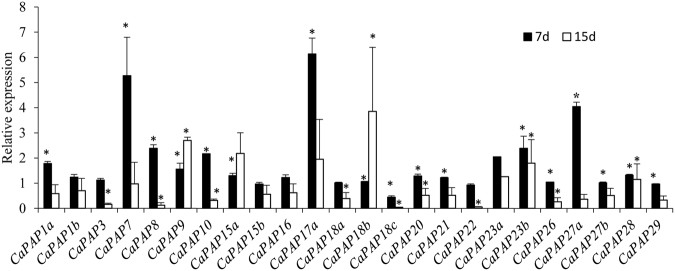
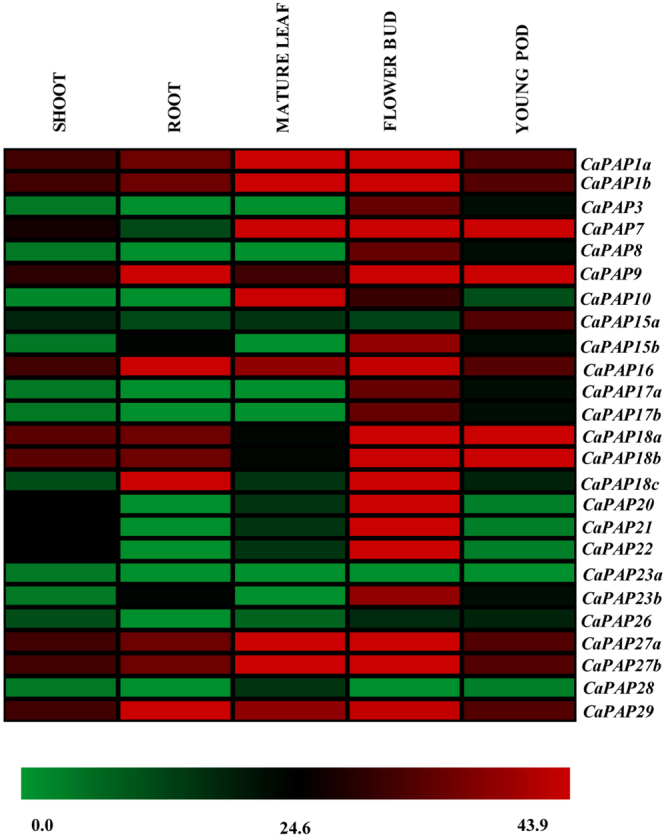
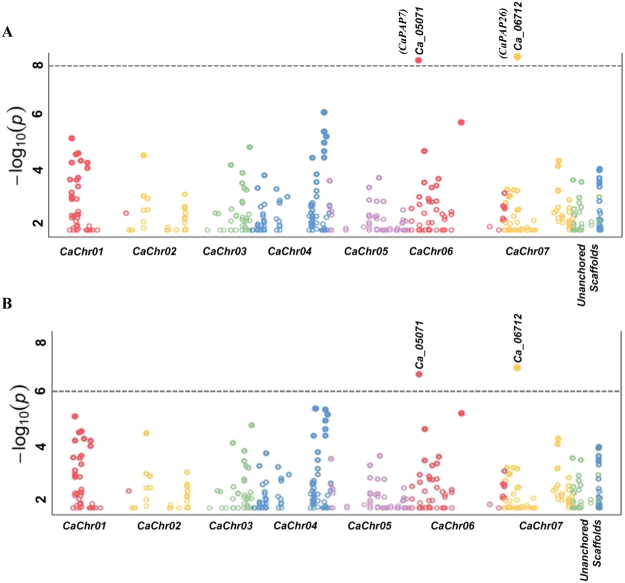
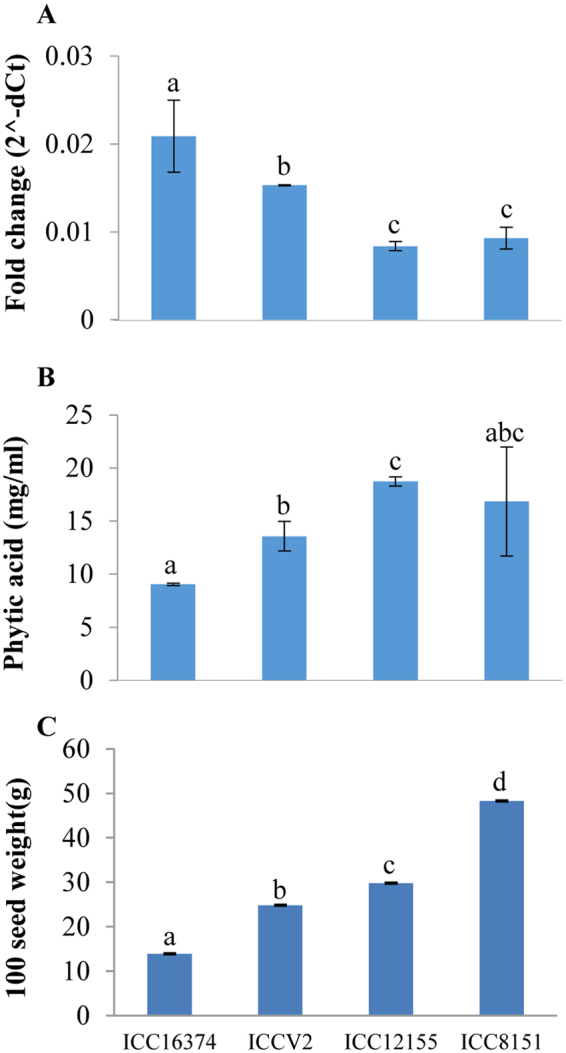
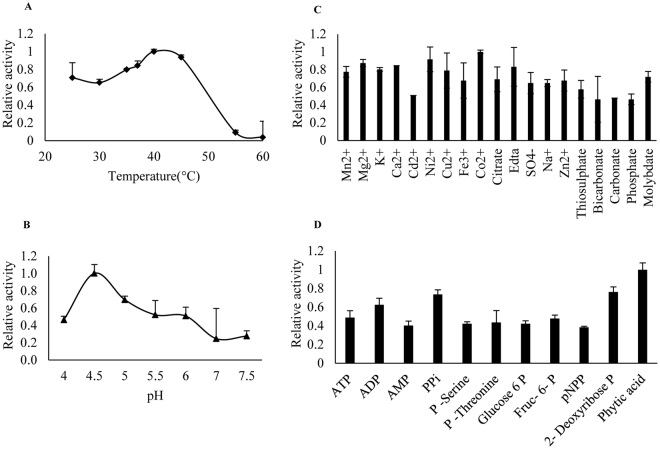
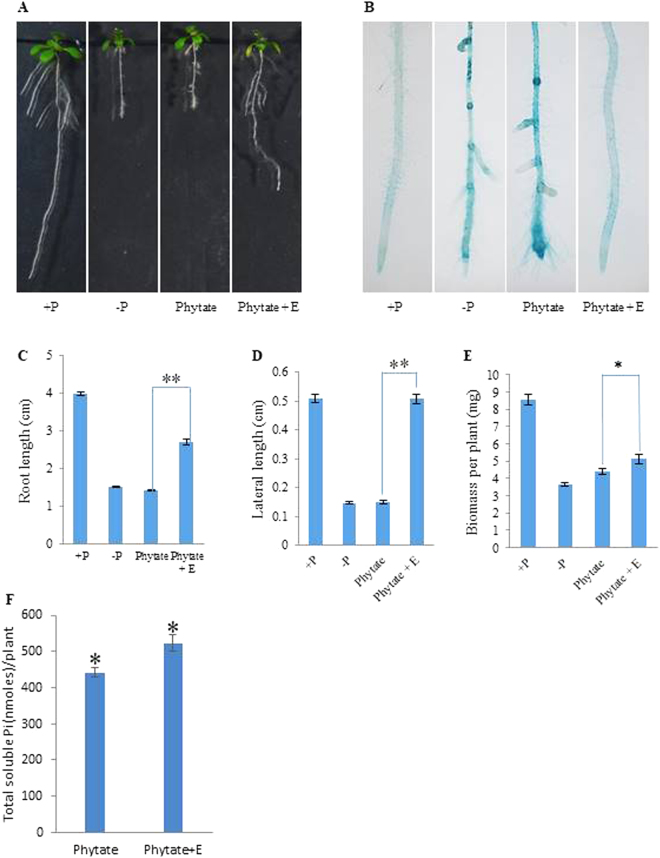
Purple acid phosphatases (PAPs) play important roles in phosphate (Pi) acquisition and utilization. These PAPs hydrolyze organic Phosphorus (P) containing compounds in rhizosphere as well as inside the plant cell. However, roles of PAPs in one of the most widely cultivated legumes, chickpea (Cicer arietnum L.), have not been unraveled so far. In the present study, we identified 25 putative PAPs in chickpea (CaPAPs) which possess functional PAP motifs and domains. Differential regulation of CaPAPs under different nutrient deficiencies revealed their roles under multiple nutrient stresses including Pi deficiency. Interestingly, most of the CaPAPs were prominently expressed in flowers and young pods indicating their roles in flower and seed development. Association mapping of SNPs underlying CaPAPs with seed traits revealed significant association of low Pi inducible CaPAP7 with seed weight and phytate content. Biochemical characterization of recombinant CaPAP7 established it to be a functional acid phosphatase with highest activity on most abundant organic-P substrate, phytate. Exogenous application of recombinant CaPAP7 enhanced biomass and Pi content of Arabidopsis seedlings supplemented with phytate as sole P source. Taken together, our results uncover the PAPs in chickpea and potential roles of CaPAP7 in seed phytate accumulation.


Conflict of interest statement

The authors declare that they have no competing interests.

Figures

Figure 1
Figure 1
Phylogenetic relationship and domain architecture of CaPAPs. (A) Phylogenetic relationship of chickpea and Arabidopsis PAPs. The amino acid sequences of CaPAPs and AtPAPs were aligned using Clustal X2 and the phylogenetic tree was constructed using NJ method with bootstrap value 1000. Bootstrap value mentioned at each node. “*” indicates CaPAPs with signal peptide (B) Conserved domains present in CaPAPs. The amino acid sequence of CaPAPs were analysed in SMART (http://smart.embl-heidelberg.de/) tool. Pur_ac_phosph_N; N terminal domain of purple acid phosphatase, Metallophos_C domain; C terminal domain of metallophos domain.
Figure 2
Figure 2
Relative expression profile of CaPAPs under Pi deficiency after 7d (early response) and 15d (late response) of treatments. qRT-PCR was used for quantification of gene expression. The relative gene expression in stressed plants was calculated considering untreated plants as control. EF1α was used as endogenous control. Error bars represent SE of average of three replicates (n = 3). *p < 0.05.
Figure 3
Figure 3
Gene expression profile of CaPAPs in shoot, root, mature leaf, flower bud and young pod of chickpea. Heat map was generated with RPM (Reads Per Million) values retrieved from CTDB (http://www.nipgr.res.in/ctdb.html). Scale bar represents RPM values.
Figure 4
Figure 4
Association of CaPAP7 and CaPAP26 with seed weight (A) and seed phytate content (B). The x-axis indicates the relative density of PAP gene based SNPs physically mapped on eight chromosomes and unannotated scaffold of Kabuli genome. The y-axis represents the −log10 p-value for significant association with traits. The SNPs with p-value ≤ 1 × 10−8 for seed weight (A) and 1 × 10−6 for seed phytate content (B) showing strong association are demarcated with dotted line.
Figure 5
Figure 5
Expression profile of CaPAP7 in genotypes differing for seed weight and phytate content. (A) Expression pattern of CaPAP7 in young pod in contrasting chickpea accessions. Fold change was calculated using EF1-α as reference gene. Three biological replicates were considered for expression analysis. Each biological replicate comprise of pooled sample from multiple plants. Error bars indicate SE (n = 3). (B) Phytic acid content of contrasting chickpea accessions (Joshi-Saha et al.). Error bars represent SE (n = 2) (C) Average seed weight (100 seed weight in g) of contrasting chickpea accessions (Kujur et al.). Error bars represent SE (n = 3) CaPAP7 expression was in negative correlation with the seed weight (r = −0.82) and seed phytate content (r = −0.99). Different letters at the top of bar indicates different significant classes determined by one-way ANOVA followed by Duncan’s multiple range test.
Figure 6
Figure 6
Biochemical properties of recombinant CaPAP7. (A) The temperature profile of CaPAP7 on pNPP in sodium acetate buffer at various temperatures for 30 min. (B) pH profile. The CaPAP7 activity was assayed in various buffers (50 mM) with different pH at 37 °C for 30 min. (C) Effect of different cofactors on CaPAP7 activity. (D) CaPAP7 activity on different substrates (10 mM) at 37 °C for 30 min. Values represent average of two replicates with std. error. Experiment was repeated three times with similar results (n = 2).
Figure 7
Figure 7
Effect of purified recombinant CaPAP7 on phytate hydrolysis and Arabidopsis growth parameters. (A) Phenotypic deference in P supplemented ( + P), P deficient (−P), P deficient + phytate (phytate) and P deficient + phytate + CaPAP7 (phytate + E) grown Arabidopsis seedlings. (B) Visualization of acid phosphatase activity by BCIP overlay on roots of Arabidopsis seedlings. (C) Average root length (n = 7 in six replicates). (D) Average lateral root length (n = 7 in six replicates). (E) Average biomass per plant (n = 7 in six replicates). (F) Total soluble Pi (nmoles per plant) (n = 6 in six replicates). All analysis was done after 7 days of growth on above said media. Error bars represent SE. Students t-test was performed for the statistical analysis **p < 0.001, *p < 0.05.

References

    1. Olczak M, Morawiecka B, Watorek W. Plant purple acid phosphatases-genes, structures and biological function. Acta Biochim. Pol. 2003;50:1245–1256. - PubMed
    1. Tran HT, Hurley BA, Plaxton WC. Feeding hungry plants: the role of purple acid phosphatases in phosphate nutrition. Plant Sci. 2010;179:14–27. doi: 10.1016/j.plantsci.2010.04.005. - DOI
    1. Duff SMG, Gautam S, Plaxton WC. The role of acid phosphatases in plant phosphorus metabolism. Physiol. Plant. 1994;90:791–800. doi: 10.1111/j.1399-3054.1994.tb02539.x. - DOI
    1. Klabunde T, Sträter N, Fröhlich R, Witzel H, Krebs B. Mechanism of Fe (III)–Zn (II) purple acid phosphatase based on crystal structures. J. Mol. Biol. 1996;259:737–748. doi: 10.1006/jmbi.1996.0354. - DOI - PubMed
    1. Schenk G, et al. Binuclear metal centers in plant purple acid phosphatases: Fe–Mn in sweet potato and Fe–Zn in soybean. Arch. Biochem. Biophys. 1999;370:183–189. doi: 10.1006/abbi.1999.1407. - DOI - PubMed

Publication types