. 2017 Sep 19;47(3):450-465.e5.
doi: 10.1016/j.immuni.2017.08.010. Epub 2017 Sep 7.

An NF-κB Transcription-Factor-Dependent Lineage-Specific Transcriptional Program Promotes Regulatory T Cell Identity and Function

Affiliations

An NF-κB Transcription-Factor-Dependent Lineage-Specific Transcriptional Program Promotes Regulatory T Cell Identity and Function

Hyunju Oh et al. Immunity. .

Abstract

Both conventional T (Tconv) cells and regulatory T (Treg) cells are activated through ligation of the T cell receptor (TCR) complex, leading to the induction of the transcription factor NF-κB. In Tconv cells, NF-κB regulates expression of genes essential for T cell activation, proliferation, and function. However the role of NF-κB in Treg function remains unclear. We conditionally deleted canonical NF-κB members p65 and c-Rel in developing and mature Treg cells and found they have unique but partially redundant roles. c-Rel was critical for thymic Treg development while p65 was essential for mature Treg identity and maintenance of immune tolerance. Transcriptome and NF-κB p65 binding analyses demonstrated a lineage specific, NF-κB-dependent transcriptional program, enabled by enhanced chromatin accessibility. These dual roles of canonical NF-κB in Tconv and Treg cells highlight the functional plasticity of the NF-κB signaling pathway and underscores the need for more selective strategies to therapeutically target NF-κB.


Figures

Figure 1
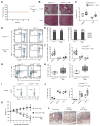
Figure 1. Discrete NF-κB subunits control sequential steps of Treg cell development
(A–B) Thymii from 5–7 weeks-old Cd4cre mice crossed to mice bearing floxed alleles of Rela and Rel, were analyzed by flow cytometry. (A) Representative dot plots of gated live CD4+CD8FoxP3 (top) and CD4+CD8 cells (bottom). Numbers indicate the % of cells in each gate. (B) Absolute numbers of CD4+CD8FoxP3CD25+GITR+ Treg precursors (left) and CD4+CD8FoxP3+ Treg cells. (C) CD4+CD8FoxP3RFP−CD25+GITR+ cells were FACS-sorted from Foxp3RFP (WT) and Foxp3RFPRelaf/f Relf/f thymii, treated with TAT-CRE and cultured with IL-2 for 2 days before analysis. Graph shows the % of FoxP3+CD25+ Treg in gated live cells. (D–F) FACS analysis of lymphoid tissues of mice described in (A). (D) Representative FoxP3 expression in gated live TCRβ+CD4+CD8. Numbers indicate the percentage in the gate. (E, F) Percentage (E) and absolute numbers of TCRβ+CD4+CD8 FoxP3+ Treg cells (F). (G) CD4+CD25CD44low naïve T cells were sorted from the LN of indicated mice and stimulated with grading doses of hTGFβ. Graph shows the % of FoxP3+ among CD4+ cells after 4 days. In B, C, E and F, data is represented as mean +/− SEM of at least 3 experiments (n=4–10 mice/group). *p<0.05, **p<0.01, ***p<0.001, n.s. non-significant. See also Figure S1.
Figure 2
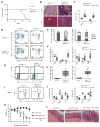
Figure 2. c-Rel is mainly dispensable for Treg homeostasis at steady-state
(A) Survival curves of WT (Foxp3YFP-creRel+/+) and Foxp3yfp-CRERelf/f littermates. (B) H/E staining of lung and liver sections from 6-week old mice. Bars=100μm; original magnification: 100X. (C–J) Lymphoid tissues of 6-week old mice were analyzed by flow cytometry. (C) Total cell count in spleen and LN. (D) Representative CD44 and CD62L expression in spleen T cells. (E–F)% and numbers of naïve (CD44lowCD62Lhi), TCM (CD44hiCD62Lhi) and TEM (CD44hiCD62Llow) in spleen T cells. (G) Representative IL-17A and IFNγ expression in spleen CD4+ T cells. Numbers indicate the % in quadrants (H) % and numbers of IFNγ+CD4+ T cells in spleen. (I) Representative FoxP3 expression in spleen CD4+ T cells. Numbers indicate the % in the gate. (J) Cumulative % and number of Treg cells in spleen. (K–L) in vivo colitis suppression assay. (K) Weight curves, shown as % of original weight. (L) Representative colon histology 6 weeks after transfer. Bars=100μm; original magnification: 100X. In C and F–J, mean +/− SEM is shown. Data is representative or cumulative of 5 mice per group from two experiments. *p<0.05, **p<0.005. See also Figure S2.
Figure 3
Figure 3. Mice lacking NF-κB p65 in Treg cells develop lethal autoimmune syndrome
(A) Survival curves of WT (Foxp3YFP-creRela+/+) and Foxp3YFP-creRelaf/f littermates. (B) H/E staining of lung and liver sections from 4–6 week-old mice. Bars=100μm; original magnification: 100X. (C–I) Lymphoid tissues of 4–6 week-old mice were analyzed by flow cytometry. (C) Total cell count in spleen and LN. (D) Representative CD44 and CD62L expression in spleen T cells. (E–F)% and numbers of naïve (CD44lowCD62Lhi), TCM (CD44hiCD62Lhi) and TEM (CD44hiCD62Llow) in spleen T cells. (G) Representative IL-17A and IFNγ expression in spleen CD4+ T cells. Numbers indicate the % in quadrants (H) % and numbers of IFNγ+CD4+ T cells in spleen. (I) Representative FoxP3 expression in spleen CD4+ T cells. Numbers indicate the % in the gate. (J) Cumulative % and number of Treg cells in spleen. (K–L) in vivo colitis suppression assay. (K) Weight curves, shown as % of original weight. (L) Representative colon histology 5 weeks after transfer. Bars=100μm; original magnification: 100X. In C and F–J, mean +/− SEM is shown. Data is representative or cumulative of 5 mice per group from 3 experiments. *p<0.05, **p<0.005. See also Figure S3.
Figure 4
Figure 4. Complete ablation of the canonical NF-κB pathway drives a Scurfy-like autoimmune syndrome
(A) Survival curves of WT (Foxp3YFP-creRela+/+Rel+/+) and Foxp3YFP-creRelaf/fRelf/f littermates. (B) H/E staining of lung and liver sections from 2–3-week old mice. Bars=100μm; original magnification: 100X. (C–I) Lymphoid tissues of 2–3 week-old mice were analyzed by flow cytometry. (C) Total cell count in spleen and LN. (D) Representative CD44 and CD62L expression in spleen T cells. (E–F)% and numbers of naïve (CD44lowCD62Lhi), TCM (CD44hiCD62Lhi) and TEM (CD44hiCD62Llow) in spleen T cells. (G) Representative IL-17A and IFNγ expression in spleen CD4+ T cells. Numbers indicate the % in quadrants. (H) % and numbers of IFNγ+CD4+ T cells in spleen. (I) Representative FoxP3 expression in spleen CD4+ T cells. Numbers indicate the % in the gate. (J) Cumulative % and number of Treg cells in spleen. (K–L) in vivo colitis suppression assay. (K) Weight curves, shown as % of original weight. (L) Representative colon histology 6 weeks after transfer. Bars=100μm; original magnification: 100X. In C and F–J, mean +/− SEM is shown. Data is representative or cumulative of 5 mice per group from two experiments. *p<0.05, **p<0.005. See also Figure S4.
Figure 5
Figure 5. Tonic canonical NF-κB signaling maintains Treg homeostasis and function in peripheral mature Treg cells
(A) Inducible deletion of Rela, Rel or both Rela and Rel in Treg cells was achieved by tamoxifen treatment of Foxp3eGFP-Cre-ERT2xRosa26stop-eYFP Relaf/f, Relf/f and Relaf/f Relf/f mice. YFP+ cells were gated from CD4+ cells and used for flow cytometry analysis. (B) Cumulative % of FoxP3+ Treg cells in total spleen CD4+ T cells. (C) YFP+ “recombined” Treg cells were sorted and stained for FoxP3, CD25 and GITR. A representative histogram is shown for each genotype. (D) Treg cells with inducible deletion of Rela and Rel after tamoxifen treatment were stimulated or not with anti-CD3 and anti-CD28 antibodies for 3 hours. RNA was prepared from those Treg cells and the expression level of Foxp3 mRNA was examined by qPCR. The mean +/− S.D is shown. Data is representative of six mice per group from three experiments. (E–F) in vivo colitis suppression assay using sorted YFP+ recombined Treg cells. (E) Weight curves, shown as % of original weight. (F) Representative colon histology 5 weeks after transfer. Bars=100 μm; original magnification: 100X. In C and F, mean +/− S.D is shown. Data is representative or cumulative of 5 mice per group from 3 experiments. *p<0.05, **p<0.005.
Figure 6
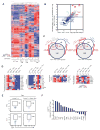
Figure 6. Canonical NF-κB shapes the molecular identity of Treg cells
Treg and Tconv cells of the indicated genotypes were FACS-sorted, in vitro-activated or not for 3 hours and submitted to RNAseq. (A) Heatmap created by unsupervised hierarchical gene clustering shows normalized expression of transcripts whose expression was changed in at least 1 condition (FC>1, ANOVA p<0.05). (B) Log2 fold changes of Rela−/−Rel−/− Treg versus WT Treg and stimulated Rela−/−Rel−/− Treg versus stimulated WT Treg. Representative genes from down-regulated genes were indicated as blue and representative genes from upregulated genes were indicated as red. The size of the selected genes indicates p-values by ANOVA. (C) 5-way ANOVA analysis was performed to assess the association between genes and different factors (factor 1: Treg or Tconv; factor 2: stimulated or not; factor 3: Rela−/−Rel−/− or not; factor 4: Rela−/− or not; factor 5: Rel−/− or not). The Venn diagrams depict downregulated (top) and upregulated (bottom). (D) Representative genes from the genes with significantly changed expression in Rela−/−Rel−/− Treg cells were categorized by their function and the expression change was presented as heatmaps. (E) Representative flow cytometry plots from intracellular staining for IFNγ and IL-17 in CD4+ FoxP3+ Treg cells from Foxp3YFP-cre and Foxp3YFP-cre Relaf/fRelf/f. (F) Treg cells were isolated from Foxp3eGFP-Cre-ERT2xRosa26stope-YFP WT and Foxp3eGFP-Cre-ERT2xRosa26stop-eYFP Relaf/fRelf/f after tamoxifen treatment and expression of various genes were examined by qPCR. Log2 fold changes (Log2 FC) of gene expression in inducible DKO versus WT were shown. See also Figure S5.
Figure 7
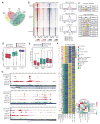
Figure 7. NF-κB regulates the Treg-associated transcriptional program
(A–F) WT Tconv and Treg cells were isolated and stimulated or not for 3 hours. p65 ChIP was performed and subjected to library preparation and sequencing as described in the Methods section. (A) The Venn diagram represents the number of p65-binding peaks and overlapping and non-overlapping peaks between four groups. (B) Heatmap showing the distribution of mean log2 p65-ChIP/input signal for Treg stim/unstim (red) and Tconv stim/unstim (blue) around peaks summits, +/− 5kb flanks from TSS, from each group: Treg-specific (red bar), Treg-Tconv shared (green bar) and constitutive (purple bar). The log2 p65-ChIP/input signal is also presented as histograms on the right. (C) Enrichment of motifs in Treg-specific peaks and Treg-Tconv shared peaks as determined by the SeqGL algorithm. (D) Comparison of quantile normalized, library-size normalized, DNase accessibility signals between Treg and Tconv around summits (+/−150bp) of three different peak sets. Mann-Whitney U test P values comparing Treg vs. Tcon signal are also provided. (E) Comparison of ATAC-seq signals between Treg and Tconv of three different peak sets. (F) The log2 TPM counts for two sets of RNAseq data for Tconv, WT Treg and Rela−/−Rel−/− Treg (Right side columns of the heatmap) corresponding to Tconv signature and Treg signature genes were displayed as a heatmap. Genes with significant expression changes in Rela−/−Rel−/− vs WT Treg and Tconv vs Treg were indicated. Genes, within its −10kb to +5kb coordinates, associated with p65 constitutive peaks, Tconv-Treg shared peaks, Treg stim-specific peaks and FoxP3 peaks are also indicated along the leftside of the heatmap. The cluster heatmap shows the pairwise −log10 p-values for fisher exacts comparing the indicated annotation groups. (G) Example genes from the set of genes including p65 Treg stim-enriched peaks. Tracks were created in WashU epigenome browser and display normalized p65, FoxP3, ATAC-seq and DNase HS sequencing signal. See also Figure S6.

Comment in

References

    1. Aschermann S, Lehmann CH, Mihai S, Schett G, Dudziak D, Nimmerjahn F. B cells are critical for autoimmune pathology in Scurfy mice. Proceedings of the National Academy of Sciences of the United States of America. 2013;110:19042–19047. - PMC - PubMed
    1. Algul H, Treiber M, Lesina M, Nakhai H, Saur D, Geisler F, Pfeifer A, Paxin S, Schmid RM. Pancreas-specific RelA/p65 truncation increases susceptability of acini to inflammtion-associated cell death following cerulein pancreatitis. J Clin Invest. 2007;117:1490–501. - PMC - PubMed
    1. Deenick EK, Elford AR, Pellegrini M, Hall H, Mak TW, Ohashi PS. c-Rel but not NF-kappaB1 is important for T regulatory cell development. Eur J Immunol. 2010;40:677–681. - PubMed
    1. Dobin A, Davis CA, Schlesinger F, Drenkow J, Zaleski C, Jha S, Batut P, Chaisson M, Gineras TR. STAR: ulatrafast universal RNA-seq aligner. Bioinformatics. 2013;29:15–21. - PMC - PubMed
    1. Gavin MA, Rasmussen JP, Fontenot JD, Vasta V, Manganiello VC, Beavo JA, Rudensky AY. Foxp3-dependent programme of regulatory T-cell differentiation. Nature. 2007;445:771–775. - PubMed

Publication types

MeSH terms