. 2017 Sep 25;27(18):2774-2783.e3.
doi: 10.1016/j.cub.2017.08.015. Epub 2017 Sep 7.

The Adder Phenomenon Emerges from Independent Control of Pre- and Post-Start Phases of the Budding Yeast Cell Cycle

Affiliations

The Adder Phenomenon Emerges from Independent Control of Pre- and Post-Start Phases of the Budding Yeast Cell Cycle

Devon Chandler-Brown et al. Curr Biol. .

Abstract

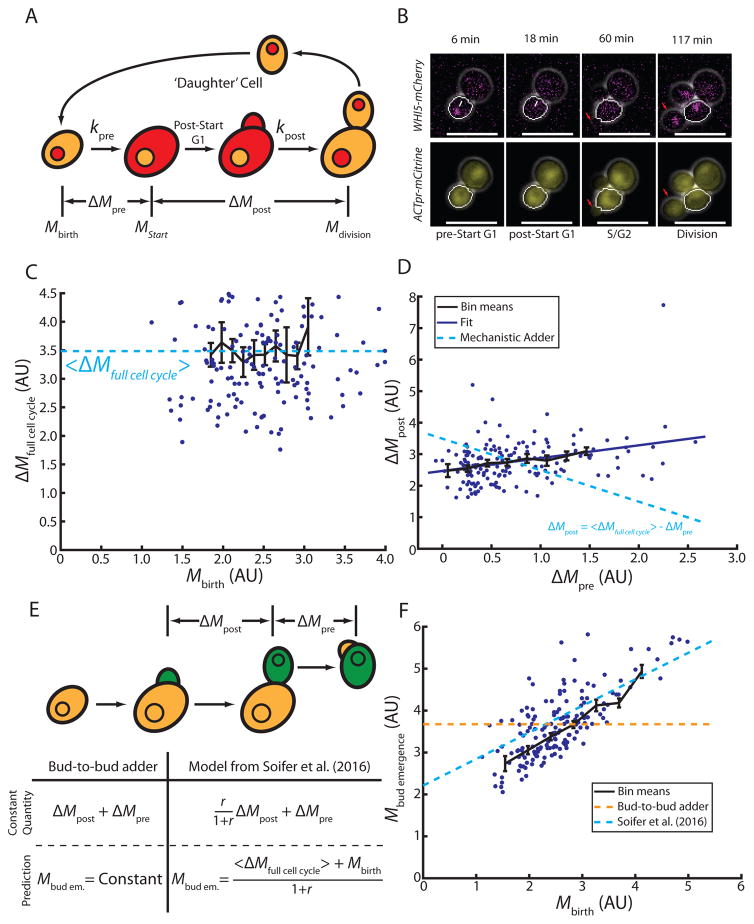
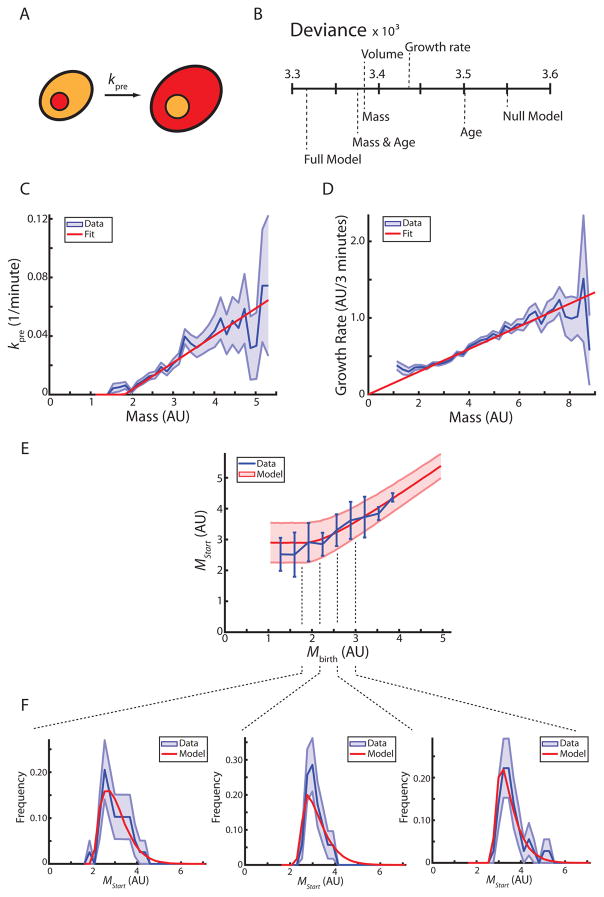
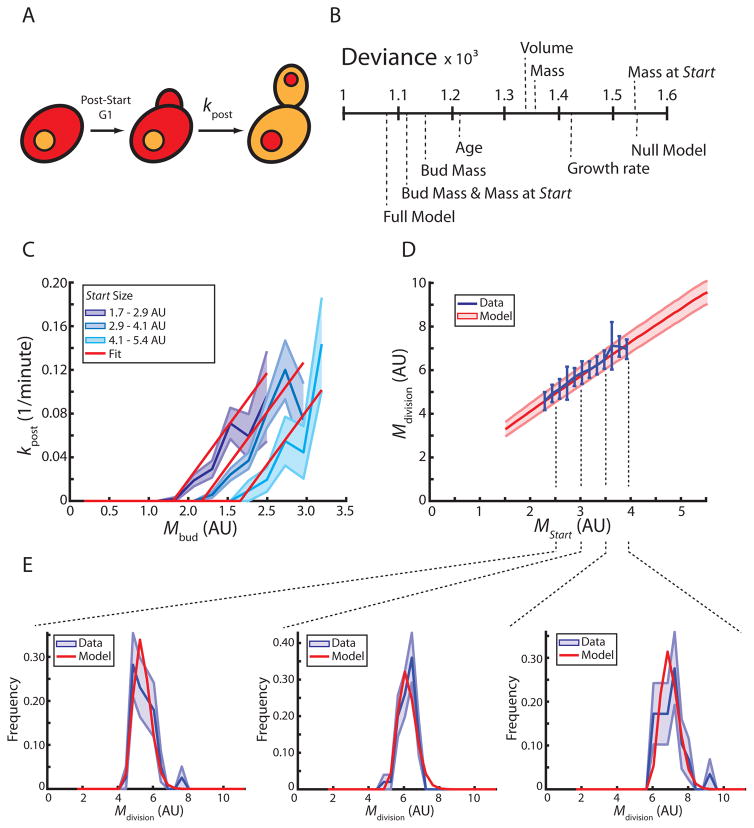
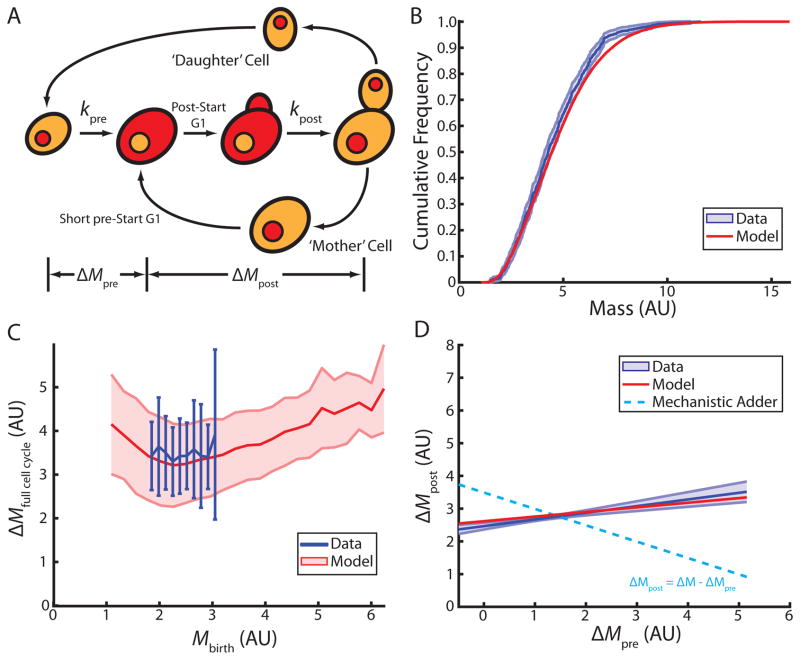
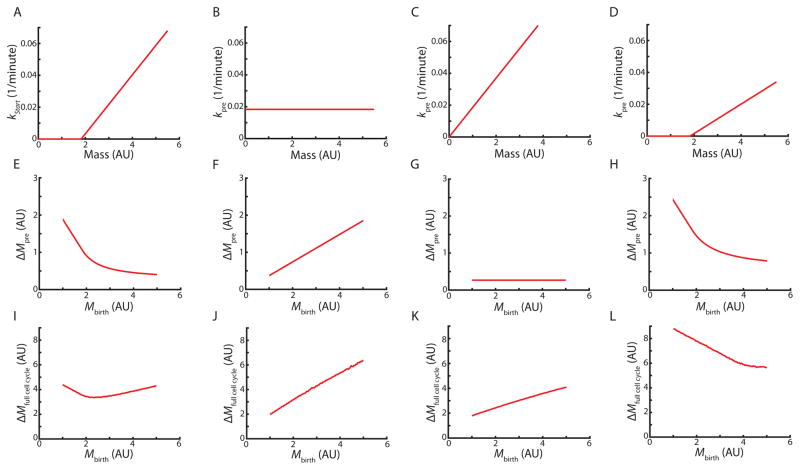
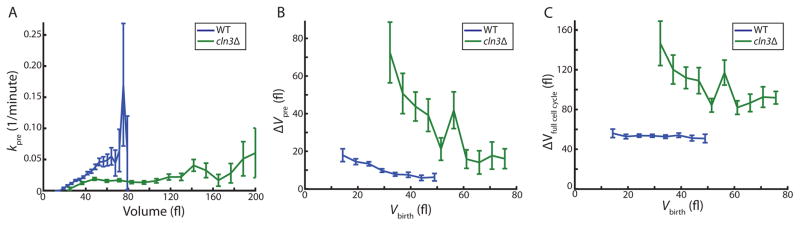
Although it has long been clear that cells actively regulate their size, the molecular mechanisms underlying this regulation have remained poorly understood. In budding yeast, cell size primarily modulates the duration of the cell-division cycle by controlling the G1/S transition known as Start. We have recently shown that the rate of progression through Start increases with cell size, because cell growth dilutes the cell-cycle inhibitor Whi5 in G1. Recent phenomenological studies in yeast and bacteria have shown that these cells add an approximately constant volume during each complete cell cycle, independent of their size at birth. These results seem to be in conflict, as the phenomenological studies suggest that cells measure the amount they grow, rather than their size, and that size control acts over the whole cell cycle, rather than specifically in G1. Here, we propose an integrated model that unifies the adder phenomenology with the molecular mechanism of G1/S cell-size control. We use single-cell microscopy to parameterize a full cell-cycle model based on independent control of pre- and post-Start cell-cycle periods. We find that our model predicts the size-independent amount of cell growth during the full cell cycle. This suggests that the adder phenomenon is an emergent property of the independent regulation of pre- and post-Start cell-cycle periods rather than the consequence of an underlying molecular mechanism measuring a fixed amount of growth.

Keywords: adder; budding yeast; cell cycle; size control.


Figures

Figure 1
Figure 1. Single cell measurements demonstrate the absence of a mechanistic adder in budding yeast
(A) Schematic illustrating the first cell cycle of ‘daughter’ cells. (B) Representative fluorescence and phase contrast images highlighting key events during the cell cycle. Daughter cell segmentation is shown in white. White arrows indicate Whi5-mCherry nuclear exit marking Start. Red arrows show the growing bud/newborn daughter. (C) Cell growth in daughter cells during the entire cell cycle as a function of birth mass (in arbitrary units, AU, n=165). Dashed line shows fit assuming constant added mass, ΔM. (D) Post-Start growth is weakly correlated with pre-Start growth (solid line shows linear fit, R = 0.32, n=165). Linear anticorrelation with slope -1 would be expected from an ideal mechanistic adder (dashed line). (E) Schematic illustrating proposed adder models implemented between subsequent budding events. Green indicates the mass included in each model. The table shows predictions from the bud-to-bud adder model and the model from Soifer et al. for the mass at bud emergence. Mbud em abbreviates mass at bud emergence, Mbud emergence. (F) Mass at bud emergence as a function of birth mass (n=73). Predictions are shown for a bud-to-bud adder model (orange) and the model proposed in [16] (blue). All bars represent binned means and standard errors. See also Figure S1.
Figure 2
Figure 2. Pre-Start size control is recapitulated by a model based on a mass-dependent rate of passing Start
(A) Schematic illustrating pre-Start G1 in daughter cells. Whi5-mCherry (red) nuclear exit defines passage through Start. (B) Logistic regressions identify cell size (volume or mass) as the major predictive parameter for passage through Start. Deviance measures how much of the data is not explained by the model (see methods). (C) The rate at which cells pass Start is shown as a function of cell mass (blue, +/− standard error). A linear fit (red) is used in the model. (D) The growth rate of daughter cells (amount of growth between two frames, 3 minutes) is shown as a function of cell mass (blue, +/− standard error). A linear fit, as expected from exponential growth, is shown in red. (E) Cell mass at Start is shown as a function of birth mass (blue, +/− standard deviation). Model prediction is shown in red (+/− standard deviation, n=165). (F) Marginal distributions of mass at Start conditioned on birth mass from (E) showing data (blue) and model (red). Standard deviation is estimated from 10000 bootstraps of the data. See also Figure S2, Table S1.
Figure 3
Figure 3. A model for post-Start cell cycle progression
(A) Schematic illustrating post-Start cell cycle phases in daughter cells. Whi5-mCherry (red) re-enters the nucleus prior to cell division. (B) Logistic regressions identify bud mass and cell mass at Start as the major predictive parameters for cell division (cell separation). Deviance measures how much of the data is not explained by the model (see methods). (C) The rate at which post-Start daughter cells divide as a function of bud mass (blue, +/− standard error, n=165). Cells are binned according to mass at Start. A two-dimensional linear fit is used for the model (n=165). Average cell mass at Start of cells in each bin was used to show the corresponding fit (red). (D) Cell mass at division as a function of mass at Start (blue, n=165). Model prediction is shown in red (+/− standard deviation). (E) Marginal distributions of mass at division conditioned on mass at Start from (D) showing data (blue) and model (red). Standard deviation is estimated from 10000 bootstraps of the data. See also Figure S3, Table S1.
Figure 4
Figure 4. Full cell cycle model based on independent regulation of pre- and post-Start periods recapitulates single cell data
(A) Schematic illustrating full cell cycle model. Pre- and post-Start periods are defined by Whi5-mCherry nuclear export (red), bud emergence, and cell separation. (B) Cumulative distribution of cell masses in a steady state population (blue, 95% confidence bounds) (n=643). Model prediction shown in red. (C) Full cell cycle growth as a function of birth mass (blue, +/− standard deviation) (n=165). Model prediction shown in red (+/− standard deviation). (D) Full cell cycle model recapitulates the weak correlation between growth during the pre- and post-Start periods (red, R=0.25, slope=0.28, p<1e–10). Linear fit to the data shown in blue (+/− standard deviation of the fit from 10000 bootstraps of the data, R=0.32, slope=0.41, p=3.2e–5). Dashed line shows the prediction of an ideal mechanistic adder. See also Figure S4.
Figure 5
Figure 5. Analytical model shows that the adder phenomenology depends on pre-Start G1 control
Relationships between cell mass and the rate of progression through Start (A–D) determine the growth during the pre-Start period (E–H) and the full cell cycle (I–L). For each scenario, the same experimentally determined growth and division rates (Figure 3) are used to model the post-Start period of the cell cycle. See also Figure S5.
Figure 6
Figure 6. Deletion of the G1 cyclin CLN3 breaks the adder
(A) The rate at which cells progress through Start as a function of cell volume for wild type (blue, n=394) and cln3Δ (green, n=197) cells. (B) Growth during the pre-Start period as a function of birth volume. (C) Growth during the full cell cycle as a function of birth volume. All bars represent binned means and standard errors. See also Figure S6.

References

    1. Goehring NW, Hyman AA. Organelle growth control through limiting pools of cytoplasmic components. Curr Biol. 2012;22:R330–9. - PubMed
    1. Marshall WF. Cell Geometry: How Cells Count and Measure Size. Annu Rev Biophys. 2016;45:49–64. - PubMed
    1. Ginzberg MB, Kafri R, Kirschner M. Cell biology. On being the right (cell) size. Science. 2015;348:1245075–1245075. - PMC - PubMed
    1. Lloyd AC. The Regulation of Cell Size. Cell. 2013;154:1194–1205. - PubMed
    1. Heald R, Hariharan IK, Wake DB, editors. Size Control in Biology. Cold Spring Harbor Press; 2015.

LinkOut - more resources