. 2018 Jan;14(1):51-61.
doi: 10.1016/j.nano.2017.08.017. Epub 2017 Sep 7.

Development of a peptide-modified siRNA nanocomplex for hepatic stellate cells

Affiliations

Development of a peptide-modified siRNA nanocomplex for hepatic stellate cells

Zhen Zhao et al. Nanomedicine. 2018 Jan.

Abstract

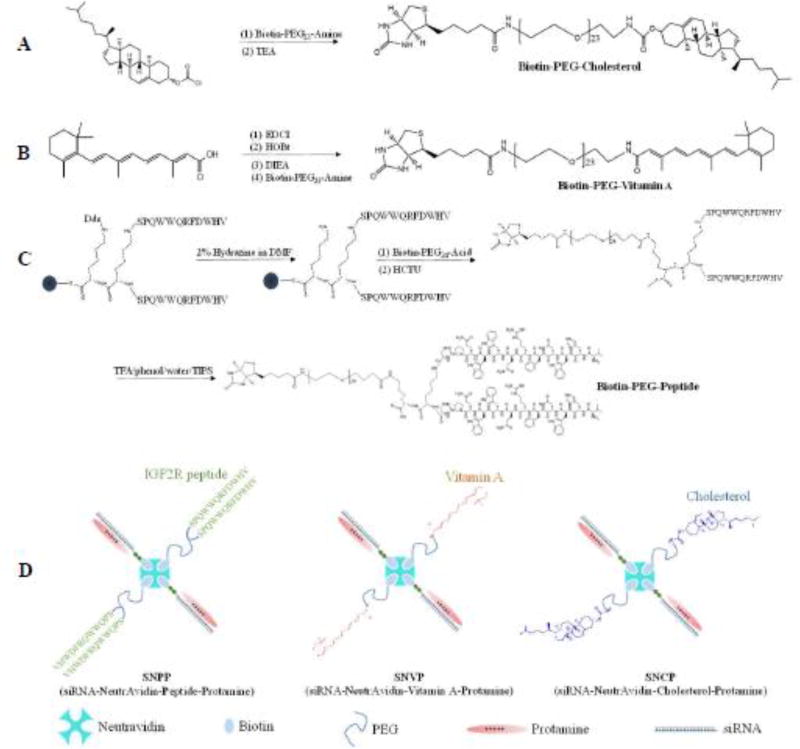
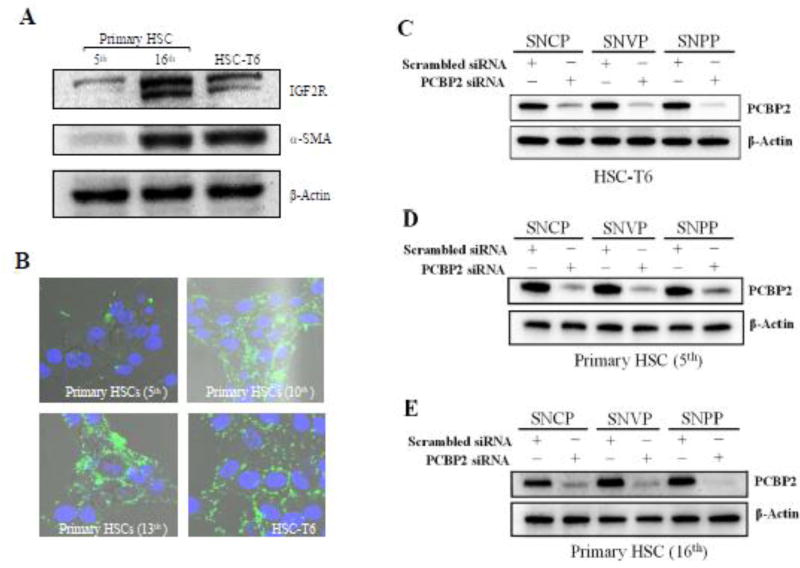
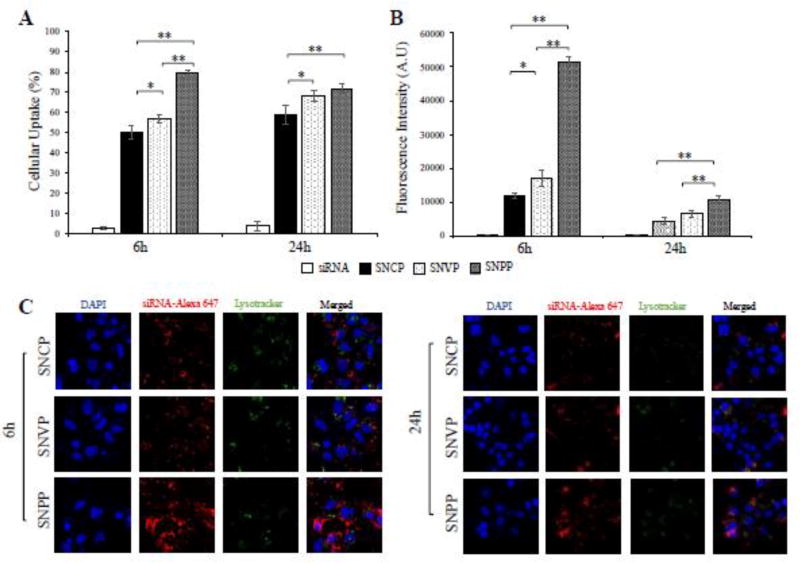
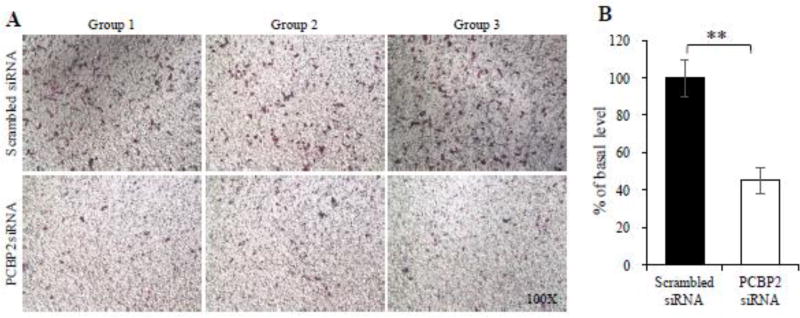
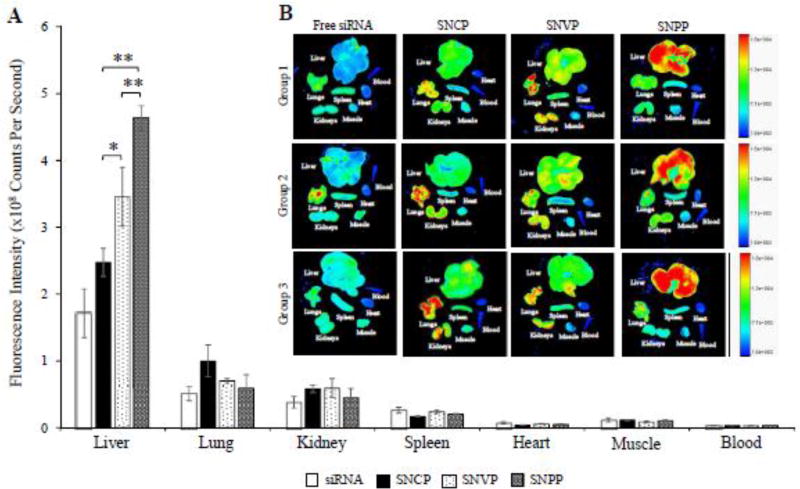
Insulin-like growth factor 2 receptor (IGF2R) is overexpressed in activated hepatic stellate cells (HSCs) and therefore can be utilized for HSC-specific drug delivery. We recently discovered an IGF2R-specific peptide using a novel biopanning. Here, we adopted biotin-conjugated IGF2R-specific peptide, cholesterol, and vitamin A as the targeting ligands for the neutravidin-based siRNA nanocomplex to deliver PCBP2 siRNA, a potentially antifibrotic agent, to HSCs. Compared to vitamin A and cholesterol, the IGF2R-specific peptide exhibited the highest targeting effect to human LX-2 HSC, rat HSC-T6 cell line, and activated primary rat HSCs. Accordingly, the IGF2R-specific peptide coupled nanocomplex demonstrated higher silencing activity of PCBP2 and better inhibition on the migration of activated HSCs. Compared to free siRNA and the nanocomplexes coupled with vitamin A and cholesterol, the IGF2R-specific peptide coupled nanocomplex showed the highest uptake in the liver and lowest uptake in the lung and kidney of the rats with CCl4-induced liver fibrosis.

Keywords: IGF2R; Liver fibrosis; Nanocomplex; Peptide ligand; Phage; Vitamin A; siRNA.


Figures

Figure 1
Figure 1. The synthesis and fabrication schemes of (A) biotin-conjugated cholesterol, (B) biotin-conjugated vitamin A, (C) biotin-conjugated IGF2R-speific peptide, and (D) the neutravidin-based siRNA nanocomplex
Biotin-conjugated PCBP2 siRNA, neutravidin and biotin-conjugated ligands were mixed in a 2:1:2 ratio at room temperature to form the siRNA-neutravidin-ligand complex, followed by condensation with protamine to form the final nanocomplex
Figure 2
Figure 2. Characterization and silencing activity of the nanocomplex
(A) Gel retardation assay of the SNCP, SNVP and SNPP nanocomplexes at different N/P ratios. (B) Zeta potential of the nanocomplexes with different N/P ratios. (C) Particle size of the nanocomplexes. (SNC: siRNA-neutravidin-cholesterol complex; SNV: siRNA-neutravidin- vitamin A complex; SNP: siRNA-neutravidin-peptide-431 complex). (D) Serum Stability of the nanocomplex in 50% rat serum for 0, 6, 12, and 24h. (E) Cytotoxicity study of the nanocomplexes.
Figure 3
Figure 3. Quantitative cellular uptake of SNCP, SNVP and SNPP nanocomplexes in HSC-T6 cells
siRNA was labeled with Alexa Flour 647 for fluorescence analysis using flow cytometry (A, B) and confocal microscopy (C, D, E). (A) Percent of the cells that take up the nanocomplexes. (B) Fluorescence intensity of the cells that take up the nanocomplexes. Confocal images of the cells treated with SNCP (C), SNVP (D) and SNPP (E) nanocomplexes at various time intervals. All results are presented as the mean ± SD (n=3). (*P<0.05; **P<0.01).
Figure 4
Figure 4
Cellular uptake of the nanocomplexes in quiescent and activated primary rat HSCs. Cellular uptake of the SNCP, SNVP and SNPP nanocomplexes containing Alexa Flour 647 labeled siRNA were evaluated in quiescent primary rat HSCs at the 5th passage generation (A, B, and C) and activated primary rat HSCs at the 16th passage generation (D, E, and F). (A, D) Percent of the cells that take up the nanocomplexes; (B, E) Fluorescence intensity of the cells that take up the nanocomplexes; (C, F) Confocal images of the cells. All results are presented as the mean ± SD (n=3). (*P<0.05; **P<0.01).
Figure 5
Figure 5. Cellular uptake and silencing activity of the nanocomplexes in activated primary rat HSCs
(A) Quiescent primary rat HSCs were activated by continuous passaging in cell culture. The protein expressions of IGR2R and α-SMA in primary rat HSCs (the 5th and 16th passage generations) were detected using western blot. (B) Cellular uptake of Fam-labeled peptide-431 (1 µM) in primary rat HSCs after different number of passages. HSC-T6 was used as a control. (C, D, E) Silencing activity of the nanocomplexes in HSC-T6, quiescent primary rat HSCs, and activated primary rat HSCs at the protein level.
Figure 6
Figure 6. Cellular uptake of the nanocomplexes in human HSC LX-2 cells
The SNCP, SNVP and SNPP nanocomplexes were incubated with LX-2 cells for 6 and 24h. (A) Percent of the cells that take up the nanocomplexes. (B) Fluorescence intensity of the cells that take up the nanocomplexes; (C) Confocal images of the cells. All results are presented as the mean ± SD (n=3). (*P<0.05; **P<0.01).
Figure 7
Figure 7. SNPP nanocomplex containing PCBP2 siRNA inhibits the migration effect of alcohol on HSC-T6
HSC-T6 cells were transfected with the SNPP nanocomplex at a concentration of 50 nM siRNA for 24 h, followed by stimulation with 100 mM alcohol for another 24 h. The cells were then harvested for migration assay using transwell chambers. All results are presented as the mean ± SD (n=3). (**P<0.01).
Figure 8
Figure 8. Biodistribution of the SNCP, SNVP and SNPP nanocomplexes in rats with CCl4-induced liver fibrotic
Fluorescence images of the major organs from three rats were presented. Region of interest (ROI) for each organ was determined by the Bruker molecular imaging software, and fluorescence intensities with respect to the area under the ROI were plotted. All results are presented as the mean ± SD (n=3). (*P<0.05; **P<0.01).

References

    1. Friedman SL. Liver fibrosis -- from bench to bedside. J Hepatol. 2003;38(Suppl 1):S38–53. - PubMed
    1. Lee YA, Wallace MC, Friedman SL. Pathobiology of liver fibrosis: a translational success story. Gut. 2015;64:830–841. - PMC - PubMed
    1. Scaglione S, et al. The Epidemiology of Cirrhosis in the United States: A Population-based Study. J Clin Gastroenterol. 2015;49:690–696. - PubMed
    1. Cheng K, Mahato RI. Gene modulation for treating liver fibrosis. Crit Rev Ther Drug Carrier Syst. 2007;24:93–146. - PMC - PubMed
    1. Raghow R. The role of extracellular matrix in postinflammatory wound healing and fibrosis. FASEB J. 1994;8:823–831. - PubMed

Publication types

MeSH terms