. 2017 Sep 21;67(6):1037-1048.e6.
doi: 10.1016/j.molcel.2017.08.006. Epub 2017 Sep 7.

Static and Dynamic DNA Loops form AP-1-Bound Activation Hubs during Macrophage Development

Affiliations

Static and Dynamic DNA Loops form AP-1-Bound Activation Hubs during Macrophage Development

Douglas H Phanstiel et al. Mol Cell. .

Abstract

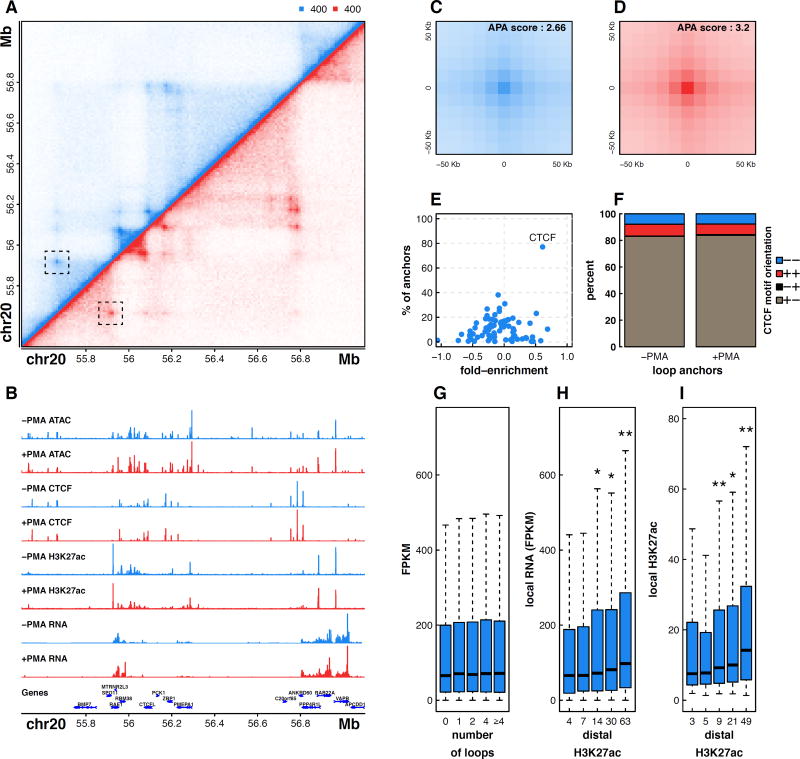
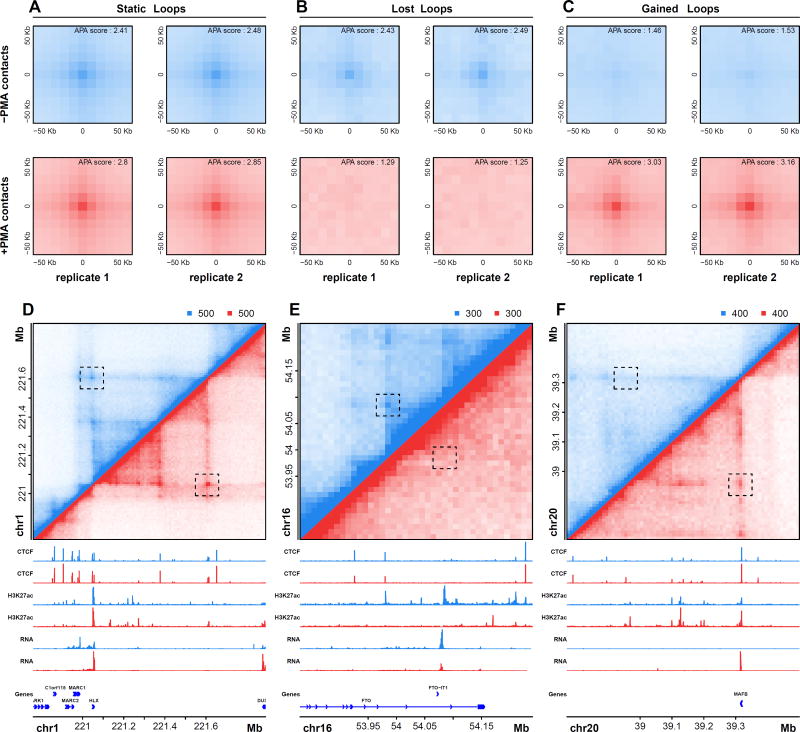
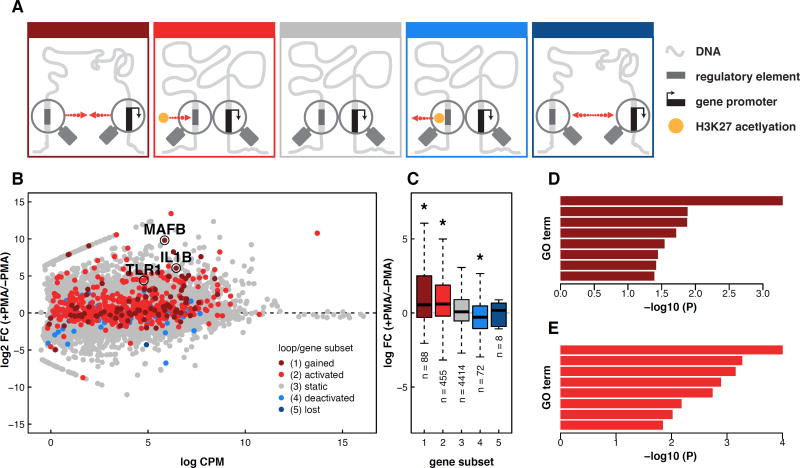
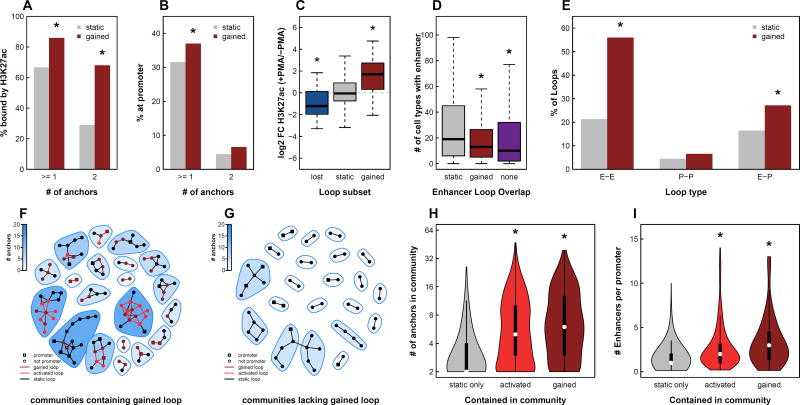
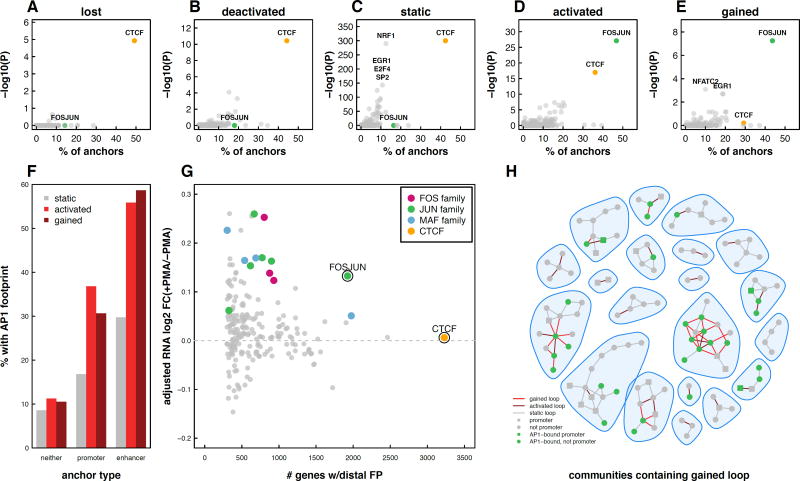
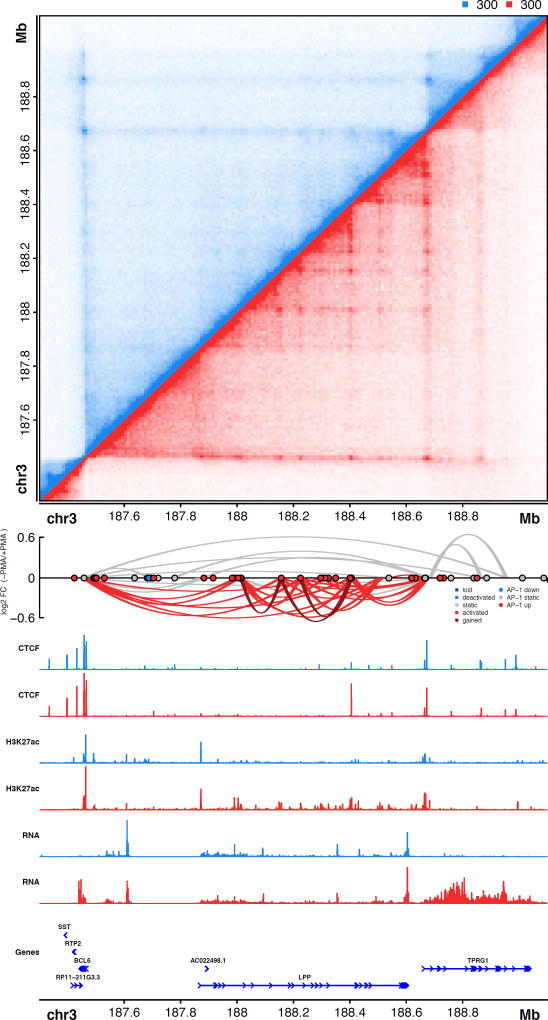
The three-dimensional arrangement of the human genome comprises a complex network of structural and regulatory chromatin loops important for coordinating changes in transcription during human development. To better understand the mechanisms underlying context-specific 3D chromatin structure and transcription during cellular differentiation, we generated comprehensive in situ Hi-C maps of DNA loops in human monocytes and differentiated macrophages. We demonstrate that dynamic looping events are regulatory rather than structural in nature and uncover widespread coordination of dynamic enhancer activity at preformed and acquired DNA loops. Enhancer-bound loop formation and enhancer activation of preformed loops together form multi-loop activation hubs at key macrophage genes. Activation hubs connect 3.4 enhancers per promoter and exhibit a strong enrichment for activator protein 1 (AP-1)-binding events, suggesting that multi-loop activation hubs involving cell-type-specific transcription factors represent an important class of regulatory chromatin structures for the spatiotemporal control of transcription.

Keywords: AP-1; CTCF; DNA looping; Hi-C; cellular differentiation.


Figures

Figure 1
Figure 1. Multi-omic mapping of chromatin architecture in untreated and +PMA treated THP-1 cells
(A) Hi-C contact matrix depicting normalized contact frequencies for untreated THP-1 cells (blue, top left) and PMA treated THP-1 cells (red, bottom right). One loop is highlighted. (B) ATAC-seq, ChIP-seq, and RNA-seq signal tracks. APA plots showing aggregated signal across all loops in both untreated (C) and PMA treated THP-1 cells (D). (E) Motif enrichment in loop anchors of untreated THP-1 cells. (F) Distribution of CTCF motif orientations at loop anchors. (G) RNA FPKM values of genes binned by the number of loops that connect to their promoter. (H) RNA FPKM values of genes binned by the histone H3K27ac signal at the promoter-distal end of a loop. (I) H3K27ac signal binned by the histone H3K27ac signal at the other end of a loop. Significant differences (p < 0.05, Wilcox Rank Sum Test) vs subset to the immediate left or all subsets to the left are indicated by one or two asterisks respectively. See also Figures S1 and S2.
Figure 2
Figure 2. Detection and visualization of differential looping events during differentiation
APA plots for loops that are static (A), lost (B), or are gained during PMA-induced differentiation of THP-1 cells (C). Individual plots for each biological replicate and condition are shown. Hi-C contract matrices, ChIP-seq signal tracks, RNA-seq signal tracks, and genes are shown for examples of static (D), lost (E), or gained (F) loops. See also Figure S3.
Figure 3
Figure 3. Expression and function of genes correlate with dynamic loop type and distal chromatin state
(A) Schematic depictions of five loop classes. Red arrows indicate direction of change during PMA-induced differentiation of THP-1 cells. ‘Ac’ refers to a change in H3K27ac as detected by ChIP-seq. (B) Counts per million vs log fold change for all transcripts measured by RNA-seq. Genes are colored according to the class of loop found at their promoter. (C) RNA FPKM values for each gene subset. Selected GO terms enriched in genes sets at gained (D) and activated (E) loop anchors.
Figure 4
Figure 4. Gained and activated loops form multi-loop multi-enhancer activation hubs
(A) The percent of static or gained loops with H3K27ac peaks at the anchors. Asterisks indicate p < 10−16 based on Fisher’s Exact Test. (B) The percent of static or gained loops with gene promoters at the anchors. Asterisks indicate p < 10−4 based on Fisher’s Exact Test. (C) Fold changes of H3K27ac peaks at lost, static, and gained loop anchors. Asterisks indicate p < 10−3 based on Wilcox Rank Sum Test. (D) Enhancers that overlapped with static loop anchors, gained loop anchors, or no loop anchors were intersected with enhancers from 98 cell types assayed by the Roadmap Epigenomics Mapping Consortium. The number of cell types containing each enhancer is depicted as a box plot. Asterisk indicates p < 10−4 based on Wilcox Rank Sum Test. (E) The percent of static or gained loops that connect an enhancer to an enhancer, a promoter to a promoter, or an enhancer to a promoter. Asterisks indicate p < 10−3 based on Fisher’s Exact Test. 20 randomly chosen interaction communities either containing (F) or lacking (G) a gained loop. Circles indicate loop anchors and lines indicate DNA loops. (H) Violin plots depicting the number of anchors per community for communities lacking gained/activated loops (static), communities containing activated loops, and communities containing gained loops. (I) Violin plots depicting the ratio of enhancers to promoters for communities lacking gained/activated loops (static), communities containing activated loops, and communities containing gained loops. See also Figure S4.
Figure 5
Figure 5. AP-1 enriched at enhancers containing loop anchors in both gained and activated loops
Scatter plots depicting the percent of lost (A), deactivated (B), static (C), activated (D), and gained (E) anchors that overlap TF footprints and the −log 10 p-value of enrichment (Fisher’s Exact Test) for each TF. (F) Percent of loop anchors that overlap an AP-1 footprint as a function of loop subset and promoter or enhancer overlap (G) RNA fold-change of genes connected via a loop to distal TF footprints. FOS, JUN, and MAF points represent individual FOS-, JUN-, and MAF-related TF footprints. Log2 fold-changes were median normalized to account for the fact that genes at loop anchors exhibited a shift towards upregulation during differentiation. (H) 20 randomly chosen interaction communities containing a gained loop are shown. Loop anchors containing AP-1 footprints are indicated in green. See also Figure S5.
Figure 6
Figure 6. AP-1 bound activation hub formed during PMA induced differentiation of THP-1 cells on chromosome 3
(Top) Hi-C contact matrix depicting normalized contact frequencies in untreated THP-1 cells (blue, top left) and PMA treated THP-1 cells (red, bottom right). (Middle) Depiction of loops, loop fold changes (y-axis), loop subset (color of loops), and differential AP-1 footprints (circles). (Bottom) ChIP-seq signal tracks, RNA-seq signal tracks, and gene structures. See also Figure S6.

References

    1. Alexander RP, Fang G, Rozowsky J, Snyder M, Gerstein MB. Annotating non-coding regions of the genome. Nat Rev Genet. 2010;11:559–571. - PubMed
    1. Beagan JA, Gilgenast TG, Kim J, Plona Z, Norton HK, Hu G, Hsu SC, Shields EJ, Lyu X, Apostolou E, et al. Local Genome Topology Can Exhibit an Incompletely Rewired 3D-Folding State during Somatic Cell Reprogramming. Cell Stem Cell. 2016;18:611–624. - PMC - PubMed
    1. Buenrostro JD, Wu B, Chang HY, Greenleaf WJ. ATAC-seq: A Method for Assaying Chromatin Accessibility Genome-Wide. Curr Protoc Mol Biol. 2015;109:21–29. 21–29. - PMC - PubMed
    1. Busslinger GA, Stocsits RR, van der Lelij P, Axelsson E, Tedeschi A, Galjart N, Peters JM. Cohesin is positioned in mammalian genomes by transcription, CTCF and Wapl. Nature. 2017;544:503–507. - PMC - PubMed
    1. Chavanas S, Adoue V, Mechin MC, Ying S, Dong S, Duplan H, Charveron M, Takahara H, Serre G, Simon M. Long-range enhancer associated with chromatin looping allows AP-1 regulation of the peptidylarginine deiminase 3 gene in differentiated keratinocyte. PLoS One. 2008;3:e3408. - PMC - PubMed

MeSH terms