. 2017 Dec:163:13-23.
doi: 10.1016/j.neuroimage.2017.09.015. Epub 2017 Sep 8.

The impact of vessel size, orientation and intravascular contribution on the neurovascular fingerprint of BOLD bSSFP fMRI

Affiliations

The impact of vessel size, orientation and intravascular contribution on the neurovascular fingerprint of BOLD bSSFP fMRI

Mario Gilberto Báez-Yánez et al. Neuroimage. 2017 Dec.

Abstract

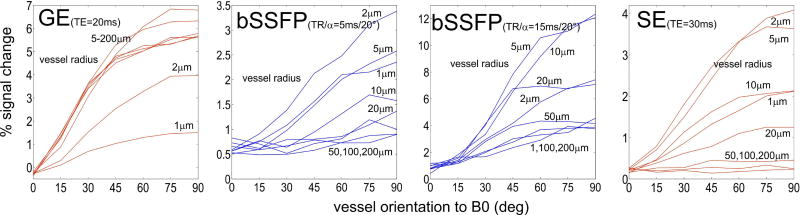
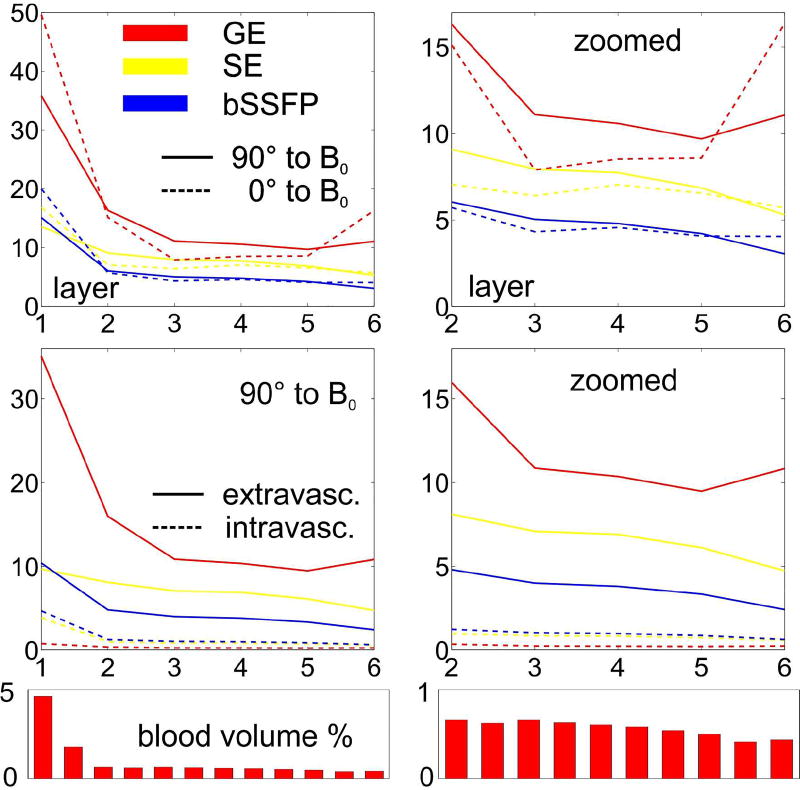
Monte Carlo simulations have been used to analyze oxygenation-related signal changes in pass-band balanced steady state free precession (bSSFP) as well as in gradient echo (GE) and spin echo (SE) sequences. Signal changes were calculated for artificial cylinders and neurovascular networks acquired from the mouse parietal cortex by two-photon laser scanning microscopy at 1 μm isotropic resolution. Signal changes as a function of vessel size, blood volume, vessel orientation to the main magnetic field B0 as well as relations of intra- and extravascular and of micro- and macrovascular contributions have been analyzed. The results show that bSSFP is highly sensitive to extravascular and microvascular components. Furthermore, GE and bSSFP, and to a lesser extent SE, exhibit a strong dependence of their signal change on the orientation of the vessel network to B0.

Keywords: Balanced SSFP; Extra- and intravascular contribution; Layer specific BOLD fMRI; Orientation-dependent BOLD fMRI; Vascular cortical network.


Figures

Fig. 1
Fig. 1
Total BOLD signal change of GE, SE and bSSFP as a function of vessel radius (randomly oriented cylinders) for different fractional BV. Blood oxygenation of Y=77% and Y=85% was assumed for the resting and activated state, respectively, at a field strength of 9.4T.
Fig. 2
Fig. 2
Extravascular BOLD signal change for bSSFP for different TR and flip angles as a function of the vessel radius (red lines are polynomial fits to the simulation results (in blue)). Blood oxygenation of Y=77% and Y=85% was assumed for the resting and activated state, respectively, at a field strength of 9.4T. Intravascular blood T2 was set to T2=12ms for the resting state and T2=20ms for the activated state. The fractional BV of the randomly oriented cylinders was set to 2% for all simulations.
Fig. 3
Fig. 3
Relation between intra- (red) and extravascular (blue) contribution for GE, SE and bSSFP based on randomly oriented cylinders as a function of fractional BV and for radii varying from 2 to 100 µm. Blood T2* was set to T2*=4ms and 8ms for GE, T2=12ms and 20ms for SE and bSSFP for the resting and activated state, respectively. The image on the right top shows a GE measurement (TE= 12 ms) depicting a larger vein (white arrow). Below is a functional activation map (visual checkerboard stimulation, 0.6 mm isotropic resolution) overlaid onto the GE image. The strong intravascular signal from a draining vein is clearly visible.
Fig. 4
Fig. 4
Total BOLD signal change as a function of the orientation of the vessel (cylinder) to B0 for GE, bSSFP and SE for different vessel radii ranging from 1 to 200 µm, and for a fractional BV of 2%.
Fig. 5
Fig. 5
Top: Vessel length and angle of vessels to the surface normal for arterioles, venules and capillaries (diameter < 7µm), averaged over the four data sets shown in Fig. 8. Bottom: Distribution of vessel diameter and tortuosity (length divided by the cord (end-to-end length)) for all vessel types.
Fig. 6
Fig. 6
The left column shows the frequency distribution (assuming Δχ = 0.22×10⁻⁷ at 9.4T and with the top surface of the vessel network oriented perpendicular to B0) around the vessel network for layers l1 to l6 for the four different data sets A to D shown in Fig. 6. The middle and right (zoomed for layers l2 to l6) column shows total BOLD signal changes for GE (TE=20ms), SE (TE=30ms) and bSSFP (TR/α=5ms/20°) across layers l1 to l6 oriented perpendicular (0°, dotted line) and parallel (90°, solid line) to B0. The corresponding fractional BV across layers extracted from the data set is shown below each plot.
Fig. 7
Fig. 7
Top row shows averaged total BOLD changes across the four data sets A to D, corresponding blood volumes are shown in the bottom row. The middle row depicts signal changes separated into extra and intra vascular part. The sum of these changes corresponds to the plots shown in the top row.
Fig. 8
Fig. 8
The left column depicts the rendered vessel data sets used for Monte Carlo simulations. The three right columns show the orientational and layer-specific total BOLD signal change dependence of GE, SE and bSSFP as relative percentage change to the reference at 90° (layer surface parallel to B0 or penetrating vessels perpendicular to B0). The red curves are the mean through all layers, i.e. represent the BOLD response of the entire cortical structure. For simplicity, orientations for θ > 90° were set equal to those of θ>90°= 180° - θ<90°.

References

    1. Bieri O, Scheffler K. Effect of diffusion in inhomogeneous magnetic fields on balanced steady-state free precession. NMR Biomed. 2007;20:1–10. - PubMed
    1. Blinder P, et al. The cortical angiome: an interconnected vascular network with noncolumnar patterns of blood flow. Nature Neuroscience. 2013;15(7):889–97. - PMC - PubMed
    1. Blockley NP, et al. Field Strength Dependence of R1 and R*2 Relaxivities of Human Whole Blood to ProHance, Vasovist, and Deoxyhemoglobin. Magn. Reson. Med. 2008;60:1313–1320. - PubMed
    1. Boas DA, et al. A vascular anatomical network model of the spatio-temporal response to brain activation. NeuroImage. 2008;40(3):1116–1129. - PMC - PubMed
    1. Bowen CV, et al. High field balanced-SSFP FMRI: a BOLD technique with excellent tissue sensitivity and superior large vessel suppression. Proc 13th ISMRM; Miami. 2005. p. 119.

Publication types

LinkOut - more resources