. 2004 Jan 1;4(1):11-18.
doi: 10.1021/nl0347334. Epub 2003 Dec 10.

Probing the Cytotoxicity Of Semiconductor Quantum Dots

Affiliations

Probing the Cytotoxicity Of Semiconductor Quantum Dots

Austin M Derfus et al. Nano Lett. .

Abstract

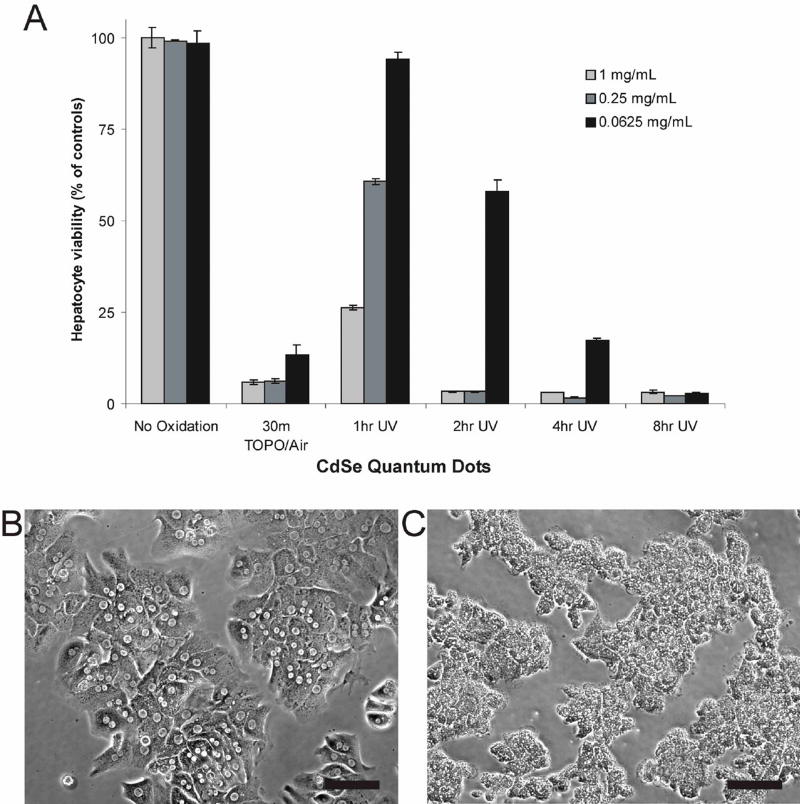
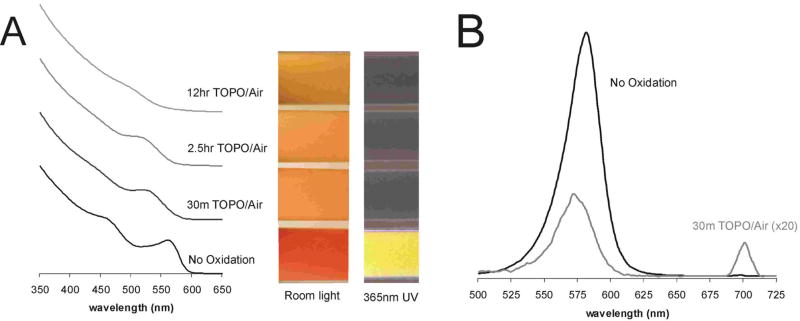
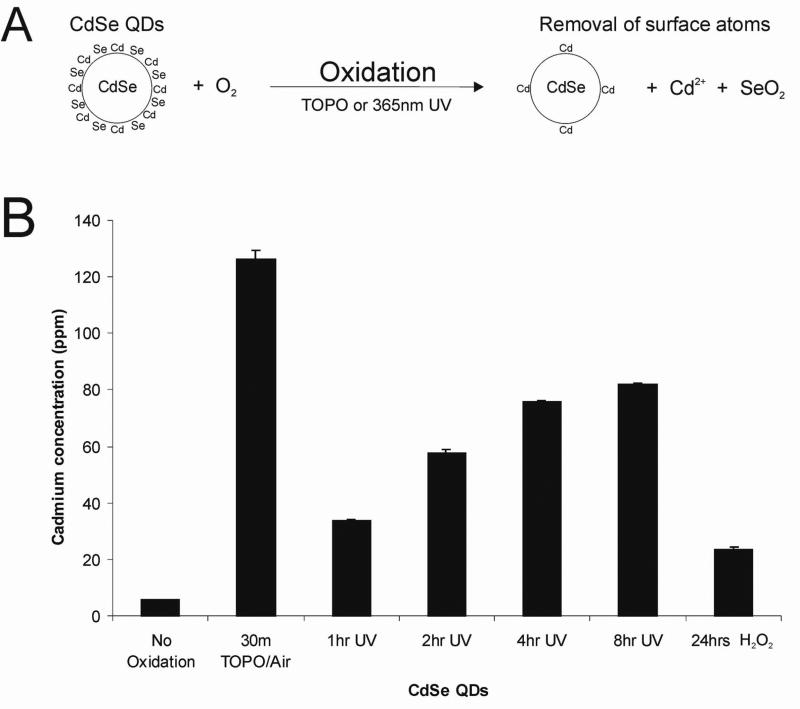
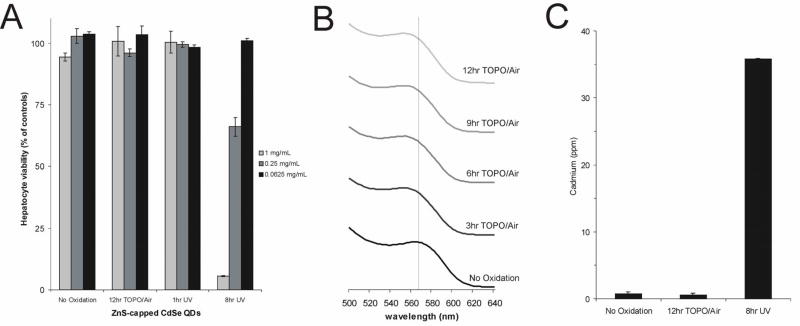
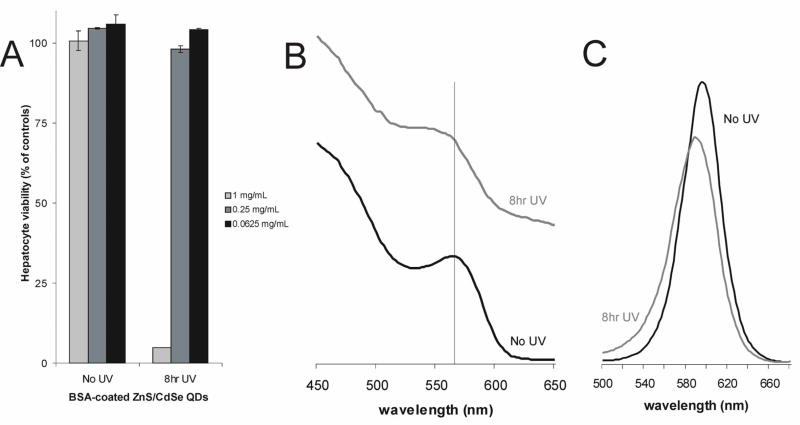
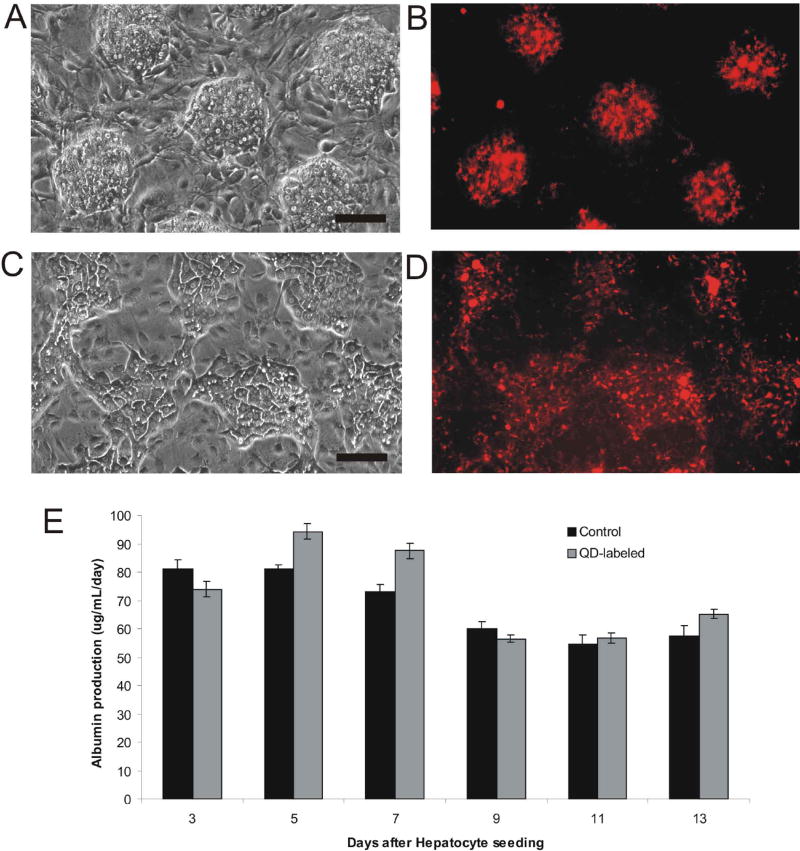
With their bright, photostable fluorescence, semiconductor quantum dots show promise as alternatives to organic dyes for biological labeling. Questions about their potential cytotoxicity, however, remain unanswered. While cytotoxicity of bulk cadmium selenide (CdSe) is well documented, a number of groups have suggested that CdSe QDs are cytocompatible, at least with some immortalized cell lines. Using primary hepatocytes as a liver model, we found that CdSe-core QDs were indeed acutely toxic under certain conditions. Specifically, we found that the cytotoxicity of QDs was modulated by processing parameters during synthesis, exposure to ultraviolet light, and surface coatings. Our data further suggests that cytotoxicity correlates with the liberation of free Cd2+ ions due to deterioration of the CdSe lattice. When appropriately coated, CdSe-core QDs can be rendered non-toxic and used to track cell migration and reorganization in vitro. Our results inform design criteria for the use of QDs in vitro and especially in vivo where deterioration over time may occur.

Keywords: cadmium; nanocrystals; nanoparticles; quantum dots; toxicity.


Figures

Figure 1
Figure 1. Toxicity Of CdSe Quantum Dots In Liver Culture Model Is Dependent On Processing Conditions And Nanoparticle Dose
(A) Hepatocyte viability as assessed by mitochondrial activity of QD-treated cultures relative to untreated controls. Thirty minutes of exposure to air while TOPO-capped renders QDs highly toxic at all concentrations tested. Ultraviolet light exposure also induces toxicity that increases with exposure time and is QD concentration-dependent. Biochemical assays of viability were confirmed via phase contrast microscopy where control hepatocyte cultures exhibited distinct intercellular boundaries, well-defined nuclei, and polygonal morphology (B). Nonviable cultures (<5% of controls) exposed to cytotoxic QDs exhibited granular cytoplasm, indistinct intercellular boundaries, undefined nuclei and evidence of blebbing (C). Scale bar corresponds to 100 μm.
Figure 2
Figure 2. Toxicity Of QDs Correlates with Surface Oxidation, Decrease of QD size, and Disruption of Crystal Lattice
(A) Increased exposure to air of TOPO-capped QDs correlates with surface oxidation as indicated by a blue-shift in the first quantum confinement peak and decrease in peak amplitude of absorbance spectra (in chloroform). Observable changes in color of QD solutions due to changes in absorbance spectra (white light – shift from red/orange to yellow) and fluorescence spectra (UV light – loss of fluorescence) are also consistent with surface oxidation. (B) Exposure to air of TOPO-capped QDs produces changes in fluorescence spectra (blue-shift of fluorescence peak by ~10 nm after 30 min) consistent with a decrease in QD size due to removal of surface atoms. For comparison, the amplitude of 30min TOPO curve has been increased 20 fold to compensate for the loss in quantum yield.
Figure 3
Figure 3. Surface Oxidation Leads to Release of Cadmium Ions
(A) Proposed mechanism of Cd release from the QD surface via either TOPO-mediated or UV-catalyzed surface oxidation. (B) Inductively coupled plasma optical emission spectroscopy (ICP/OES) measurements of free cadmium in 0.25mg/mL solutions of QDs, indicating higher levels of free cadmium in all oxidized samples and increasing Cd levels with UV exposure time, correlating with cytotoxicity observed in Figure 1A.
Figure 4
Figure 4. Effects of ZnS Surface Coating on Surface Oxidation, Release of Cadmium, and Cytotoxicity
(A) ZnS capping of CdSe QDs eliminates TOPO/air-induced cytotoxicity and reduces photooxidation-mediated cytotoxicity as indicated by viability of QD-treated hepatocytes compared to Figure 1A. (B) While the CdSe core remains intact, the absorbance spectra of TOPO/air treated QDs displays a blue shift, possibly indicating a disruption of the ZnS cap (in chloroform). (C) Free cadmium levels measured by ICP/OES in 0.25 mg/mL QD solution correlate with patterns of cytotoxicity observed in (A).
Figure 5
Figure 5. Effects of Bovine Serum Albumin Surface Coating on Surface Oxidation and Cytotoxicity
BSA-coated ZnS-capped QDs were photoxidized with ultraviolet light and compared to unexposed controls. (A) Photooxidation of BSA-coated QDs rendered QDs toxic only at high doses (1 mg/mL) after extensive exposure (8 h). Note the reduced cytotoxicity of 0.25 mg/mL after 8 h of UV exposure (98% viability) as compared to ZnS capped dots under similar conditions (66% viability). (B) Photooxidation of BSA-coated QDs resulted in an observable change in the absorbance spectra (a decrease in the first quantum confinement peak), and (C) a change in the fluorescence spectra (a decrease in amplitude and blue-shift), corresponding to oxidation of the CdSe QD core.
Figure 6
Figure 6. Application of Coated QDs to Long-term Tracking of Primary Cells Without Compromising Liver-specific Function
Hepatocytes were co-cultivated with non-parenchymal cells (3T3 fibroblasts) to support liver-specific functions in vitro. Hepatocytes were labeled by endocytosis of EGF-coated red QDs. Co-cultures were organized in regular arrays using previously reported ‘micropatterning’ techniques and cell migration was monitored by phase contrast and fluorescence microscopy. (A) Phase contrast micrograph of micropatterned array of hepatocyte colonies (~100 μm) surrounded by fibroblasts on day 1 of co-culture and corresponding fluorescence image (B) of QD-labeled hepatocytes. Scale bar corresponds to 100μm (C) Phase contrast micrograph of co-culture demonstrates visible reorganization of hepatocyte colonies and corresponding fluorescence image (D) of QD-labeled hepatocytes after 7 days of co-culture. (E) Liver-specific functions of QD-labeled hepatocytes were comparable to control co-cultures for two weeks of culture as assessed by daily albumin secretion and averaged over two day periods.

References

    1. Lam CW, James JT, McCluskey R, Hunter RL. Toxicol Sci. 2003 - PubMed
    1. Warheit DB, Laurence BR, Reed KL, Roach DH, Reynolds GA, Webb TR. Toxicol Sci. 2003 - PubMed
    1. Chan WC, Nie S. Science. 1998;281:2016–2018. - PubMed
    1. Bruchez M, Moronne M, Gin P, Weiss S, Alivisatos AP. Science. 1998;281:2013–2016. - PubMed
    1. Chan WC, Maxwell DJ, Gao X, Bailey RE, Han M, Nie S. Curr Opin Biotechnol. 2002;13:40–46. - PubMed

LinkOut - more resources