. 2017 Aug 25:8:1044.
doi: 10.3389/fimmu.2017.01044. eCollection 2017.

Porcine B Cell Subset Responses to Toll-like Receptor Ligands

Affiliations

Porcine B Cell Subset Responses to Toll-like Receptor Ligands

Roman Othmar Braun et al. Front Immunol. .

Abstract

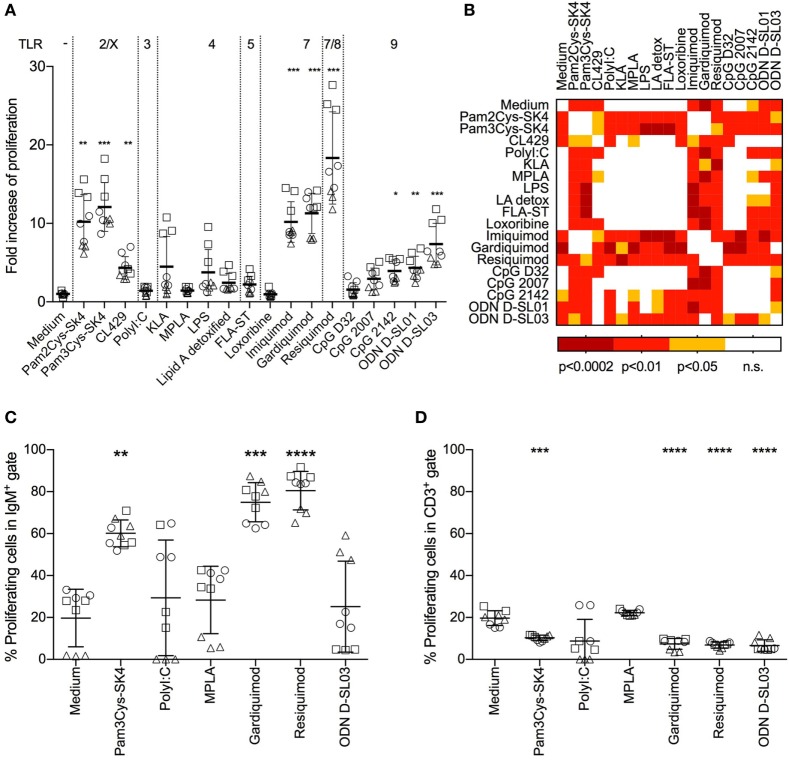
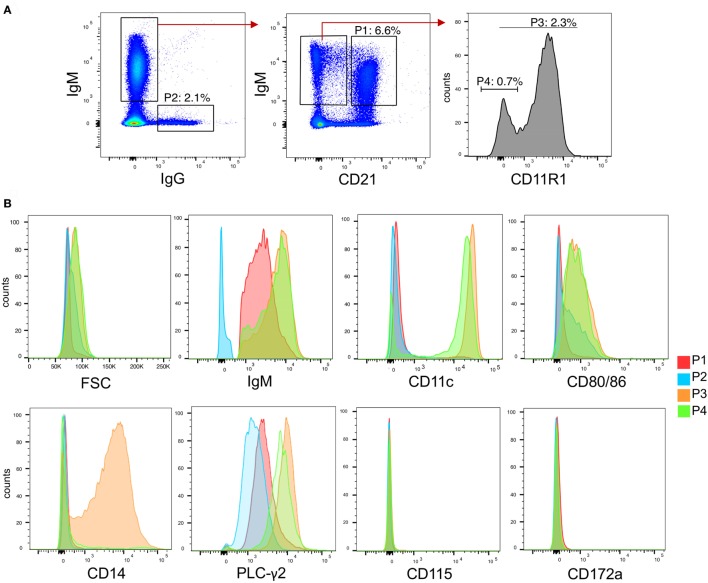
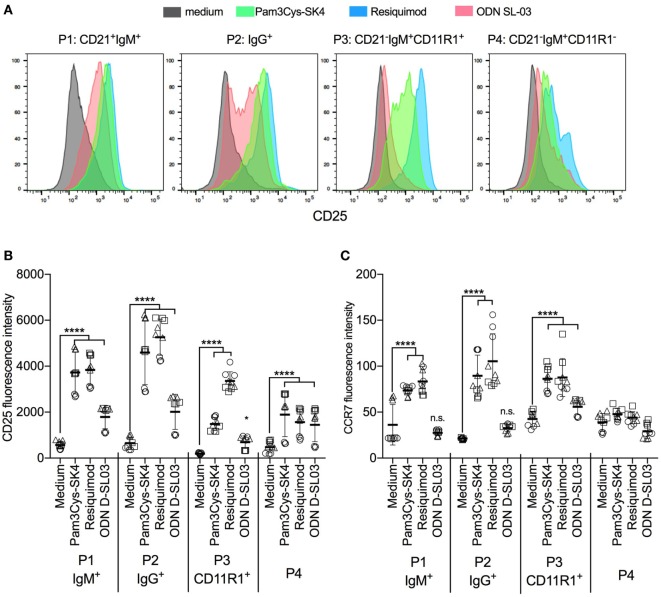
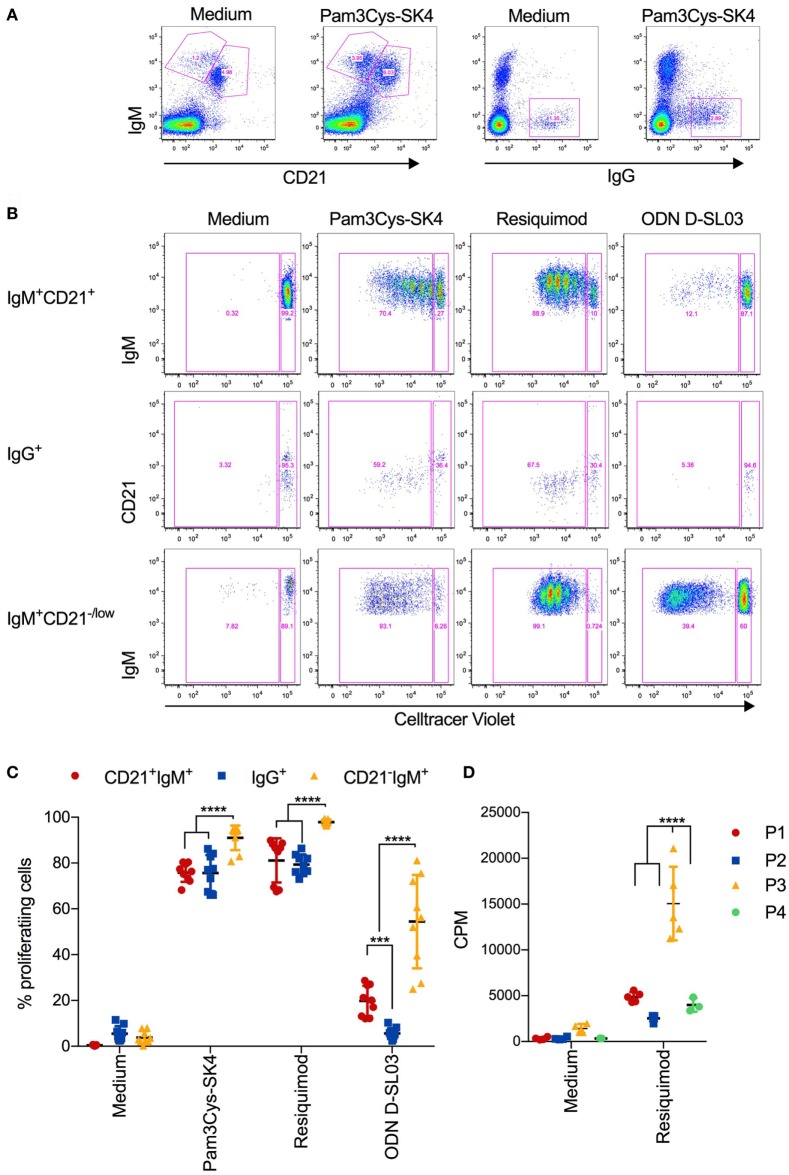
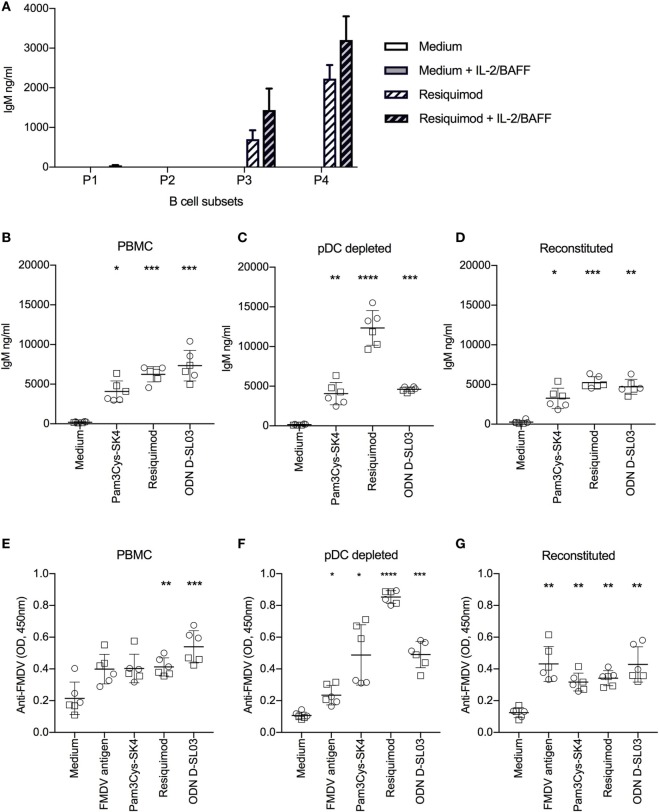
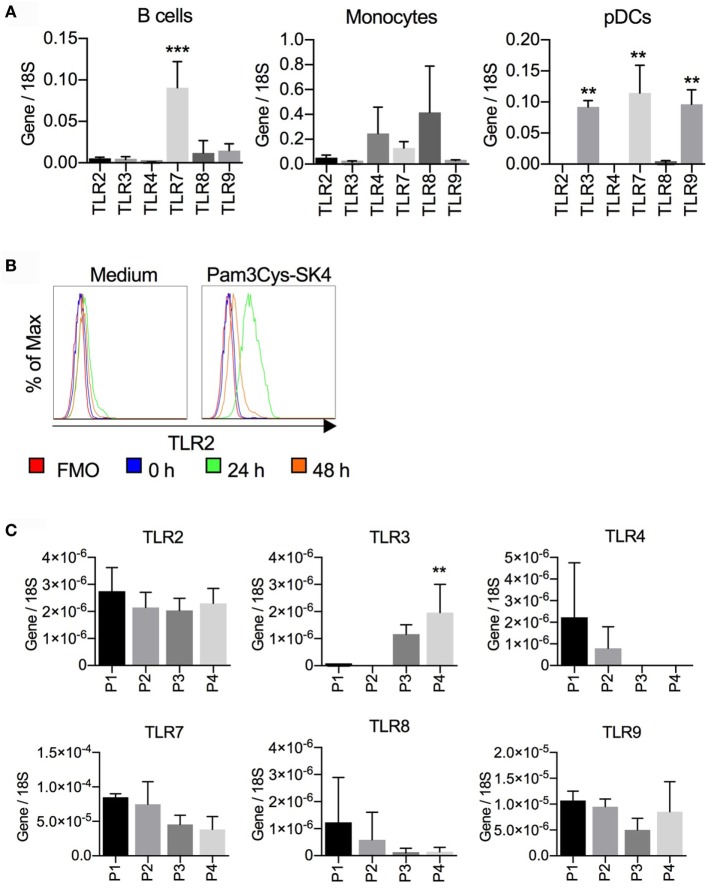
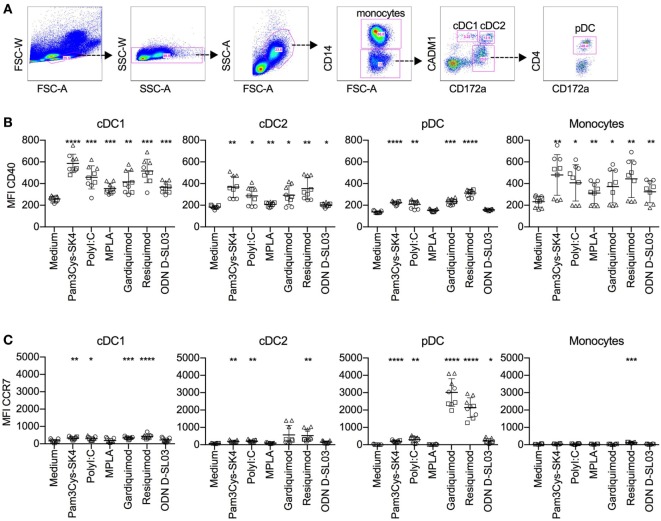
Toll-like receptors (TLR) triggering of B cells are known to promote B cell expansion, differentiation of B cells into antibody-producing and memory cells, but the TLR responses of porcine B cells is poorly characterized. Therefore, this study investigated the response pattern of porcine B cell subsets to a large collection of TLR ligands and demonstrates that the TLR2 ligand Pam3Cys-SK4 and the TLR7/8 ligands gardiquimod and resiquimod are particularly efficient at inducing proliferation, CD25 and CCR7. This activation was also determined in B-cell subpopulations including a CD21+IgM+ subset, an IgG+ subset and two putative B1-like subsets, defined as CD21-IgMhighCD11R1+CD11c+CD14+ and CD21-IgMhigh CD11R1-CD11c+CD14- B cells. The latter two were larger and expressed higher levels of CD80/86 and spontaneous phospholipase C-γ2 phosphorylation. All porcine B-cell subsets were activated by TLR2, TLR7, and TLR9 ligands. Naïve and memory conventional B cells responded similar to TLR ligands. The CD11R1+ B1-like subset had the highest proliferative responses. While both B1-like subsets did not spontaneously secrete IgM, they were the only subsets to produce high level of TLR-induced IgM. Similar to polyclonal IgM responses, memory B cells were efficiently induced to produce specific antibodies by CpG oligodinucleotide, resiquimod, and to a weaker extend by Pam3Cys-SK4. Depletion of plasmacytoid dendritic cells (pDCs) enhanced TLR-induced antibodies. The same set of TLR ligands also induced CD40 on cDCs, pDCs, and monocytes with the exception of TLR4 ligand being unable to activate pDCs. Gardiquimod and resiquimod were particularly efficient at inducing CCR7 on pDCs. Porcine B cells expressed high levels of TLR7, but relatively little other TLR mRNA. Nevertheless, TLR2 on B cells was rapidly upregulated following stimulation, explaining the strong responses following stimulation. Subset-specific analysis of TLR expression demonstrated a comparable expression of TLR2, TLR7, and TLR9 in all B cell subsets, but TLR3 was restricted to B1-like cells, whereas TLR4 was only expressed on conventional B cells, although both at low levels. Altogether, our data describe porcine innate B1-like cells, and how different B cell subsets are involved in innate sensing.

Keywords: B cells; dendritic cells; innate immunity; toll-like receptors; vaccine adjuvants.


Figures

Figure 1
Figure 1
Proliferative response of B cells in whole peripheral blood mononuclear cells (PBMCs) after stimulation with toll-like receptor ligands. (A) Proliferation of PBMCs after stimulation for 3 days was determined using a 3H-thymidine assay. The fold increase over the medium control is shown. (B) Heatmap giving an overview of the statistical significances found between the treatments shown in (A). (C) Proliferation of IgM+ B cells determined by flow cytometry using CellTraceViolet. The percentage of proliferating cells in the IgM gate is shown. (D) Proliferating CD3+ T cells, again determined using CellTrace Violet. The percentage of proliferating cells in the CD3 gate is shown. (A,C,D) PBMC culture triplicates from three different animals, each depicted by a different shape. Mean values are indicated by horizontal bars. Error bars show SDs. Statistical significance was calculated using ANOVA followed by Tukey’s test (****P < 0.0001; ***P < 0.001; **P < 0.01; *P < 0.05; n.s., not significant).
Figure 2
Figure 2
B cell subsets in peripheral blood of pigs. (A) Gating strategies for identifying B cell subsets based on expression of IgG, IgM, CD21, and CD11R1. After doublet exclusion, population 1 (P1) was defined as CD21+IgM+, P2 as IgG+, P3 as CD21IgM+CD11R1+, and P4 as CD21IgM+CD11R1. (B) Histogram overlays of FSC, IgM, CD11c, CD80/86, CD14, phosphor-PLC-γ2, CD115, and CD172a for the subsets P1–P4 identified in (A). A representative animal out of three is shown.
Figure 3
Figure 3
Activation markers on B cell subsets after stimulation with toll-like receptor (TLR) ligands. (A) Histogram overlays of CD25 expression on the B cell subsets P1–P4 defined as shown in Figure 2. Peripheral blood mononuclear cells (PBMCs) were cultured and stimulated overnight and B-cell subset identified using multicolor flow cytometry. A representative animal out of three is shown. (B,C) Fluorescence intensity of CD25 and CCR7 after stimulation of PBMC with TLR ligands. PBMCs were stimulated overnight and B-cell subsets identified using multicolor flow cytometry. Triplicates cultures from three different animals, each depicted by a different symbol, are shown. Mean values are indicated by horizontal bars. Error bars show SDs. Statistical significance was calculated using ANOVA followed by Tukey’s test.
Figure 4
Figure 4
Proliferative responses of B cell subsets after stimulation with toll-like receptor (TLR) ligands (A) Gating strategy defining CD21+IgM+, CD21+IgM+, and IgG+ B cells, exemplified for unstimulated and Pam3Cys-SK4 stimulated peripheral blood mononuclear cells (PBMCs) after 5 days of culture. (B) CellTrace Violet staining of the three B-cell subsets defined in (A) using multicolor flow cytometry. PBMCs were cultured for 5d. A representative animal out of three is shown. (C) Percentage of proliferating B cell subsets, defined as shown in (A,B), after stimulation of PBMCs with the indicated TLR ligands. Triplicates cultures from three different animals are shown. (D) Proliferation of FACS-sorted B cell subsets after stimulation for 3 days was determined using 3H-thymidine incorporation. P1 was defined and sorted as CD21+IgM+ subset, P2 as IgG+ subset, P3 as CD21IgM+CD11R1+ subset, and P4 as CD21IgM+CD11R1 subset (for gate definition see Figure 2). (C,D) Mean values are indicated by horizontal bars. Error bars show SDs. Statistical significance was calculated using ANOVA followed by Tukey’s test.
Figure 5
Figure 5
Antibody production after stimulation with toll-like receptor (TLR) ligands. (A) Spontaneous and induced IgM responses by B cell subsets. The B cell subsets P1–P4 defined as shown in Figure 2 were FACS-sorted, cultured at 0.5 × 106 cells/ml and stimulated with resiquimod in the absence or presence of interleukin-2 (IL-2) and B-cell activating factor (BAFF) for 5 days. IgM production in the supernatants was quantified by ELISA. (B) TLR-induced IgM production induced of full PBMCs, of plasmacytoid dendritic cell (pDC)-depleted PBMCs (C), and of PBMCs reconstituted with pDC following sorting (D). (E–G) FMDV-specific IgG-antibody levels detected in the same setup as in (B–D). (B–G) Cells were cultured for 7 days. Six biological replicates of two independent experiments are shown. Statistical significance was calculated using ANOVA followed by Tukey’s test (****P < 0.0001; ***P < 0.001; **P < 0.01; *P < 0.05).
Figure 6
Figure 6
Toll-like receptor (TLR) mRNA expression in B cells, monocytes, and plasmacytoid dendritic cells (pDCs). (A) CD21+ B cells and CD14+ monocytes were sorted by magnetic cells sorting (purity > 98%); CD172a+CD4high pDCs were purified by fluorescence activated cell sorting (FACS) (purity > 99%). RNA was isolated for RTqPCR analysis of TLR expression. Data are from three biological replicates generated using cells from three different pigs. In B cells, TLR7 expression was significantly higher than all other TLR (***P < 0.0001). In pDC, TLR3, TLR7, and TLR9 were found to be significantly higher when compared to the other TLRs (**P < 0.001). (B) Expression of TLR2 on CD21+ cells after stimulation of peripheral blood mononuclear cells with Pam3Cys-SK4 for 24 h. A representative experiment from three independent experiments is shown. (C) TLR mRNA expression of B cell subsets P1–P4 sorted by FACS according to the gates defined in Figure 2. Mean values calculated from three different animals with standard deviations are shown. P4 was statistically significant from P1 and P2 for TLR3 expression (*P < 0.05).
Figure 7
Figure 7
Activation marker response of DC subsets after stimulation with toll-like receptor (TLR) ligands. Peripheral blood mononuclear cells were cultured with TLR ligands for 5 h, and activation marker expression on mononuclear subsets was determined using five-color flow cytometry. (A) Gating strategy for identifying conventional DC1 (cDC1), cDC2, and plasmacytoid dendritic cell (pDC) subsets. After doublet exclusion and forward/side scatter gating on large cells, monocytes were identified as CD14+ cells, cDC1 as CD14CD172alowCADM1+, cDC2 as CD14CD172ahighCADM+, and pDC as CD14CD172+CD4+. (B) CD40 levels. (C) CCR7 levels on mononuclear cell subsets. The figure shows biological replicates of three independent experiments. Statistical significance was calculated using ANOVA followed by Tukey’s test (****P < 0.0001; ***P < 0.001; **P < 0.01; *P < 0.05).

References

    1. Baumgarth N. The double life of a B-1 cell: self-reactivity selects for protective effector functions. Nat Rev Immunol (2011) 11(1):34–46. 10.1038/nri2901 - DOI - PubMed
    1. Underhill DM, Ozinsky A, Hajjar AM, Stevens A, Wilson CB, Bassetti M, et al. The toll-like receptor 2 is recruited to macrophage phagosomes and discriminates between pathogens. Nature (1999) 401(6755):811–5. 10.1038/44605 - DOI - PubMed
    1. Alexopoulou L, Holt AC, Medzhitov R, Flavell RA. Recognition of double-stranded RNA and activation of NF-kappaB by toll-like receptor 3. Nature (2001) 413(6857):732–8. 10.1038/35099560 - DOI - PubMed
    1. Poltorak A, He X, Smirnova I, Liu MY, Van Huffel C, Du X, et al. Defective LPS signaling in C3H/HeJ and C57BL/10ScCr mice: mutations in Tlr4 gene. Science (1998) 282(5396):2085–8. 10.1126/science.282.5396.2085 - DOI - PubMed
    1. Hayashi F, Smith KD, Ozinsky A, Hawn TR, Yi EC, Goodlett DR, et al. The innate immune response to bacterial flagellin is mediated by toll-like receptor 5. Nature (2001) 410(6832):1099–103. 10.1038/35074106 - DOI - PubMed