

A spatially resolved estimate of High Mountain Asia glacier mass balances, 2000-2016
- PMID: 28890734
- PMCID: PMC5584675
- DOI: 10.1038/NGEO2999
A spatially resolved estimate of High Mountain Asia glacier mass balances, 2000-2016
Abstract
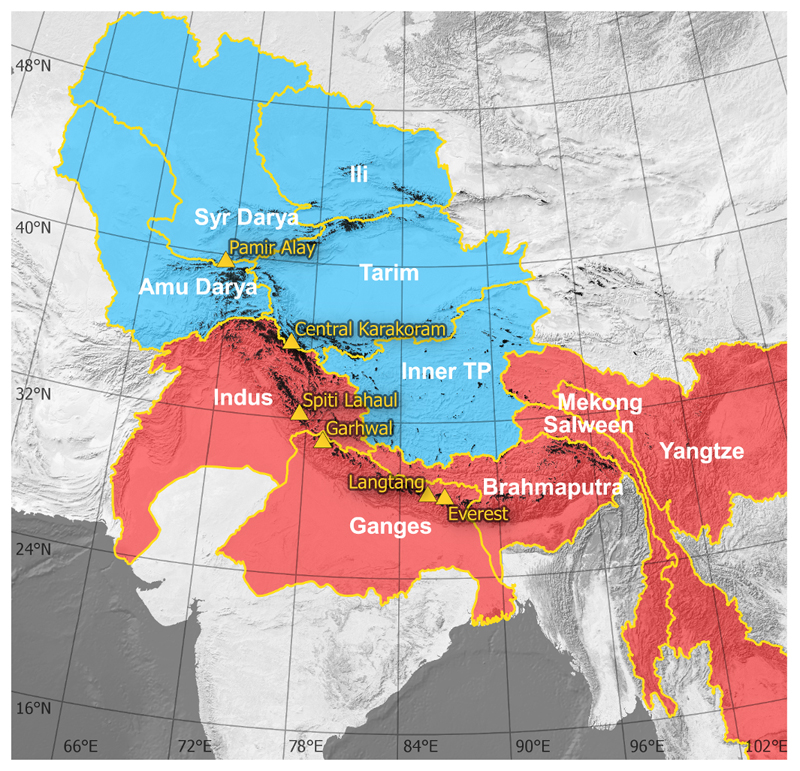
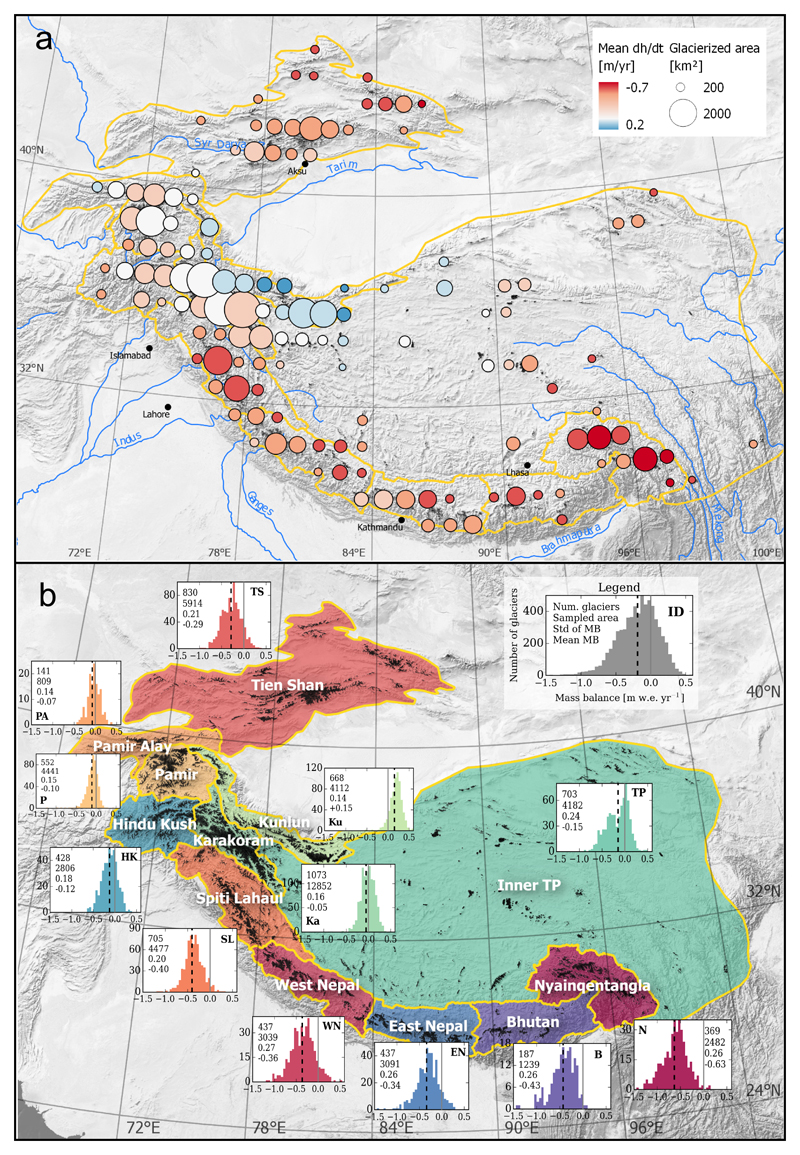
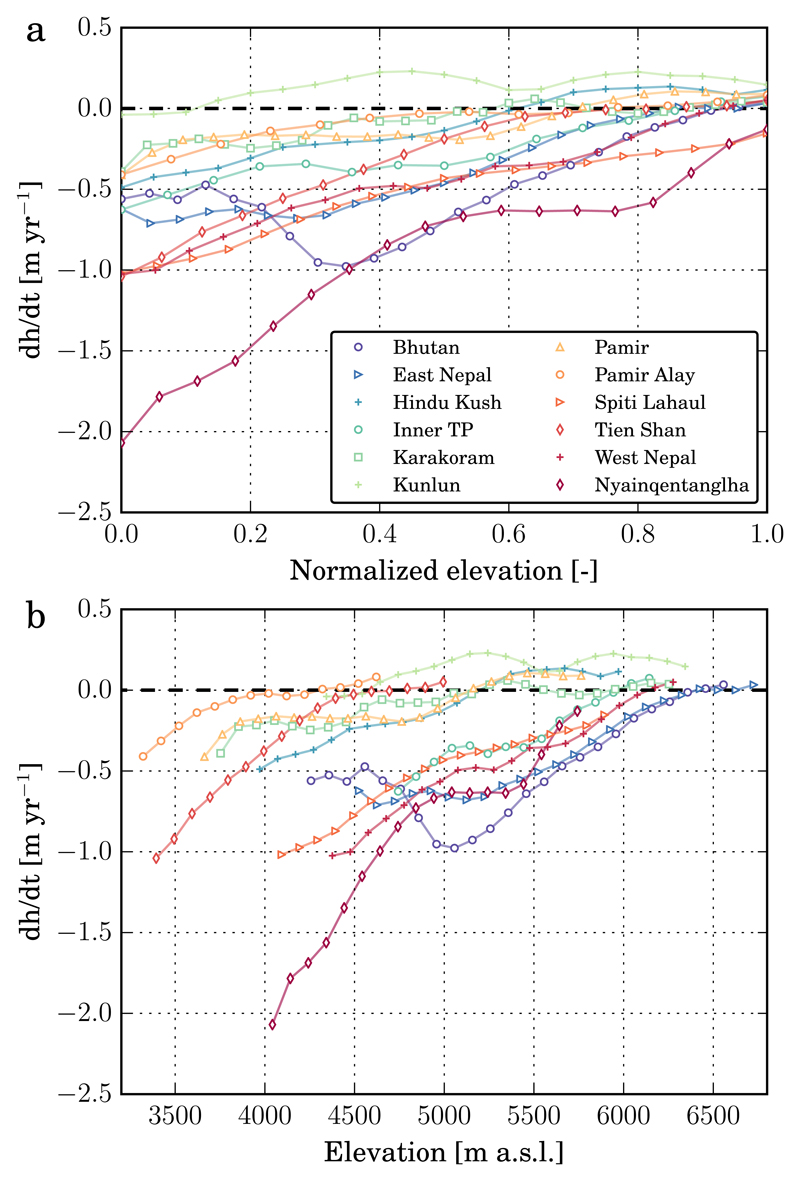
High Mountain Asia hosts the largest glacier concentration outside the polar regions. These glaciers are important contributors to streamflow in one of the most populated areas of the world. Past studies have used methods that can only provide regionally-averaged glacier mass balances to assess the High Mountain Asia glacier contribution to rivers and sea level rise. Here we compute the mass balance for about 92 % of the glacierized area of High Mountain Asia using time series of digital elevation models derived from satellite stereo-imagery. We calculate an average region-wide mass balance of -16.3 ± 3.5 Gt yr-1 (-0.18 ± 0.04 m w.e. yr-1) between 2000 and 2016, which is less negative than most previous estimates. Region-wide mass balances vary from -4.0 ± 1.5 Gt yr-1 (-0.62 ± 0.23 m w.e. yr-1) in Nyainqentanglha to +1.4 ± 0.8 Gt yr-1 (+0.14 ± 0.08 m w.e. yr-1) in Kunlun, with large intra-regional variability of individual glacier mass balances (standard deviation within a region ˜0.20 m w.e. yr-1). Specifically, our results shed light on the Nyainqentanglha and Pamir glacier mass changes, for which contradictory estimates exist in the literature. They provide crucial information for the calibration of the models used for projections of future glacier response to climatic changes, models that presently do not capture the pattern, magnitude and intra-regional variability of glacier changes in High Mountain Asia.
Conflict of interest statement
Competing financial interests The authors declare no competing financial interests
Figures
References
-
- Jacob T, Wahr J, Pfeffer WT, Swenson S. Recent contributions of glaciers and ice caps to sea level rise. Nature. 2012;482:514–518. - PubMed
-
- Gardner AS, et al. A Reconciled Estimate of Glacier Contributions to Sea Level Rise: 2003 to 2009. Science. 2013;340:852–857. - PubMed
-
- Bolch T, et al. The State and Fate of Himalayan Glaciers. Science. 2012;336:310–314. - PubMed
-
- Kääb A, Treichler D, Nuth C, Berthier E. Brief Communication: Contending estimates of 2003-2008 glacier mass balance over the Pamir–Karakoram–Himalaya. The Cryosphere. 2015;9:557–564.
-
- Cogley JG. Geodetic and direct mass-balance measurements: comparison and joint analysis. Ann Glaciol. 2009;50:96–100.
Grants and funding
LinkOut - more resources
Full Text Sources
Other Literature Sources
Miscellaneous