

Quantitative comparison of the spreading and invasion of radial growth phase and metastatic melanoma cells in a three-dimensional human skin equivalent model
- PMID: 28890854
- PMCID: PMC5590551
- DOI: 10.7717/peerj.3754
Quantitative comparison of the spreading and invasion of radial growth phase and metastatic melanoma cells in a three-dimensional human skin equivalent model
Abstract
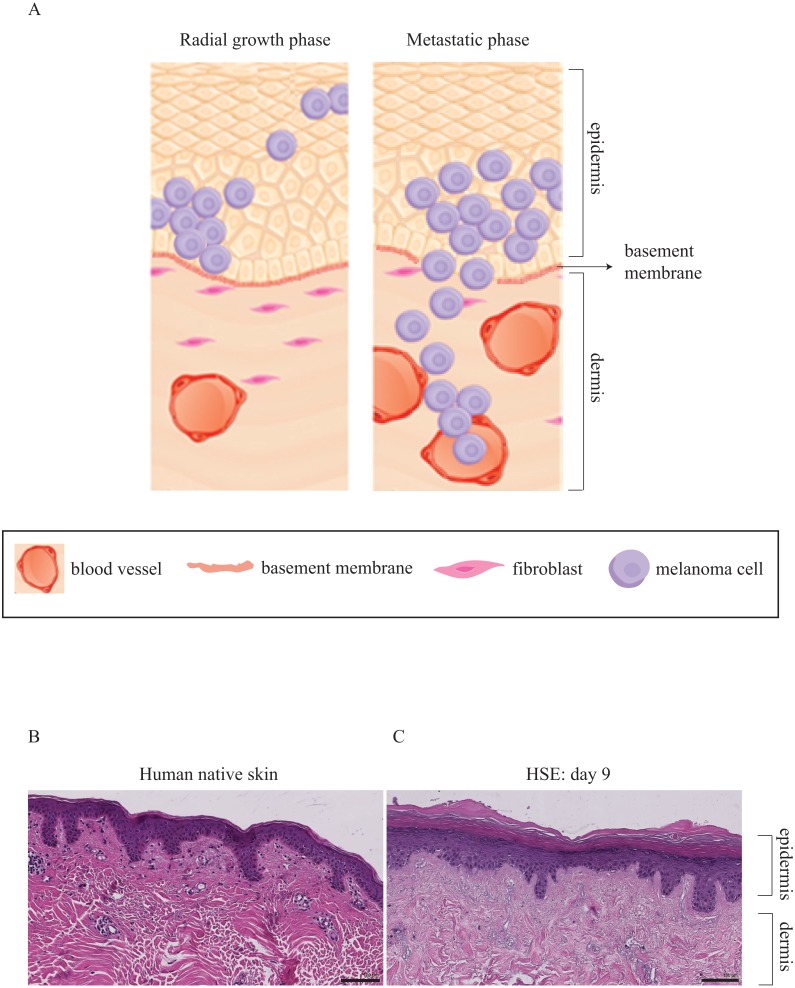
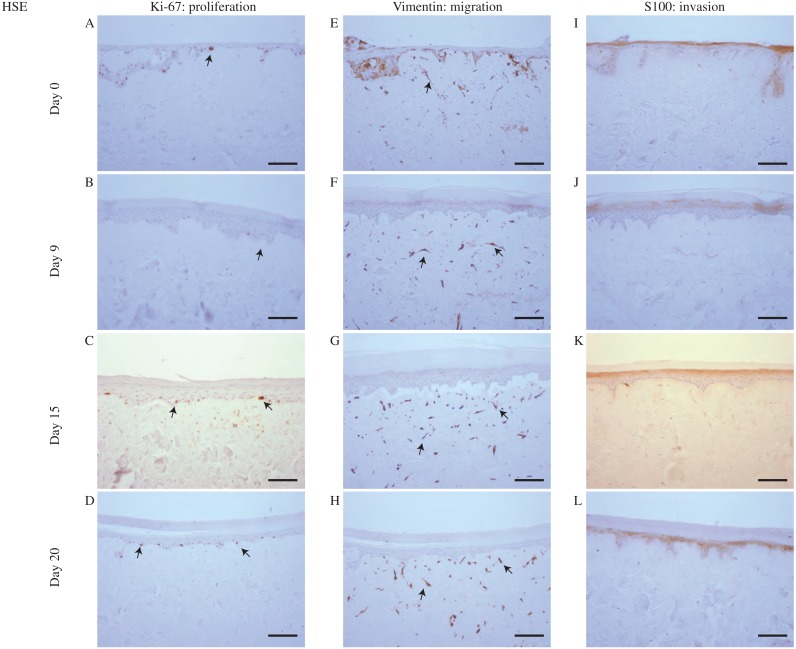
Background: Standard two-dimensional (2D) cell migration assays do not provide information about vertical invasion processes, which are critical for melanoma progression. We provide information about three-dimensional (3D) melanoma cell migration, proliferation and invasion in a 3D melanoma skin equivalent (MSE) model. In particular, we pay careful attention to compare the structure of the tissues in the MSE with similarly-prepared 3D human skin equivalent (HSE) models. The HSE model is identically prepared to the MSE model except that melanoma cells are omitted. Using the MSE model, we examine melanoma migration, proliferation and invasion from two different human melanoma cell lines. One cell line, WM35, is associated with the early phase of the disease where spreading is thought to be confined to the epidermis. The other cell line, SK-MEL-28, is associated with the later phase of the disease where spreading into the dermis is expected.
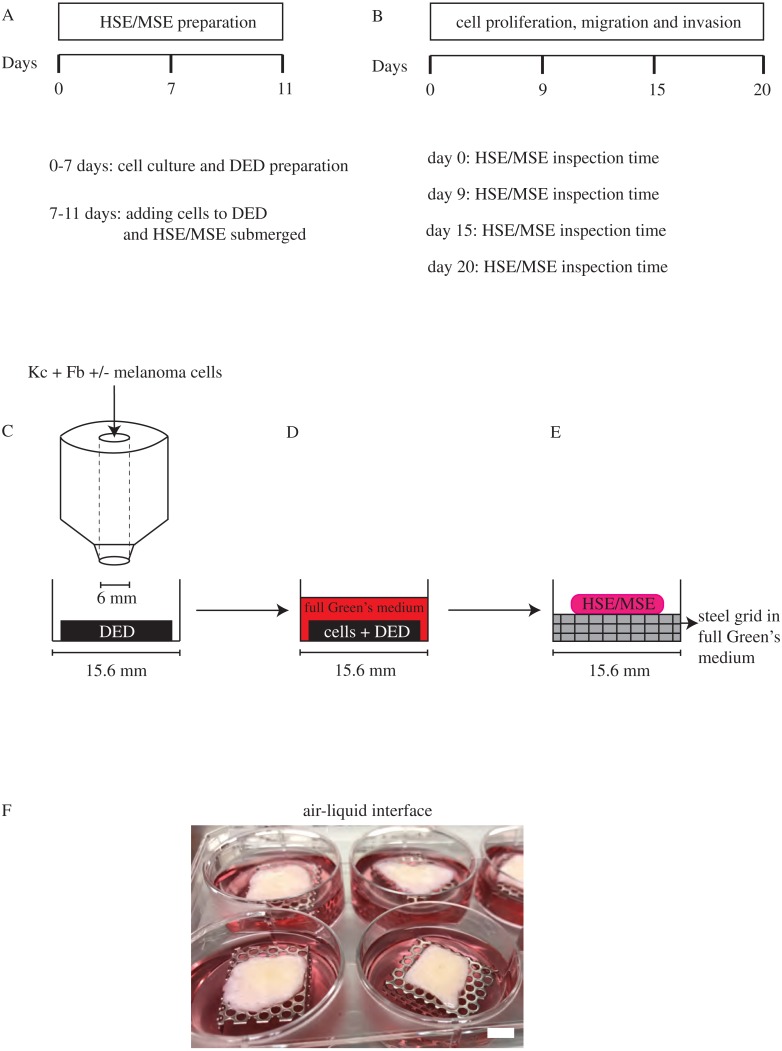
Methods: 3D MSE and HSE models are constructed using human de-epidermised dermis (DED) prepared from skin tissue. Primary fibroblasts and primary keratinocytes are used in the MSE and HSE models to ensure the formation of a stratified epidermis, with a well-defined basement membrane. Radial spreading of cells across the surface of the HSE and MSE models is observed. Vertical invasion of melanoma cells downward through the skin is observed and measured using immunohistochemistry. All measurements of invasion are made at day 0, 9, 15 and 20, providing detailed time course data.
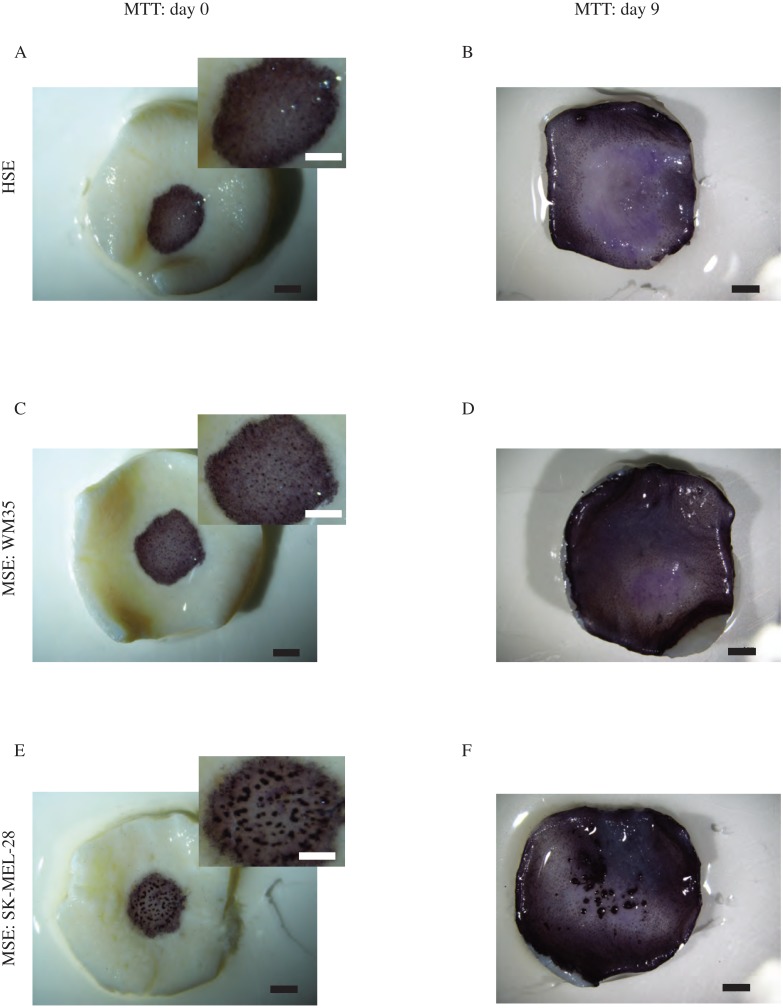
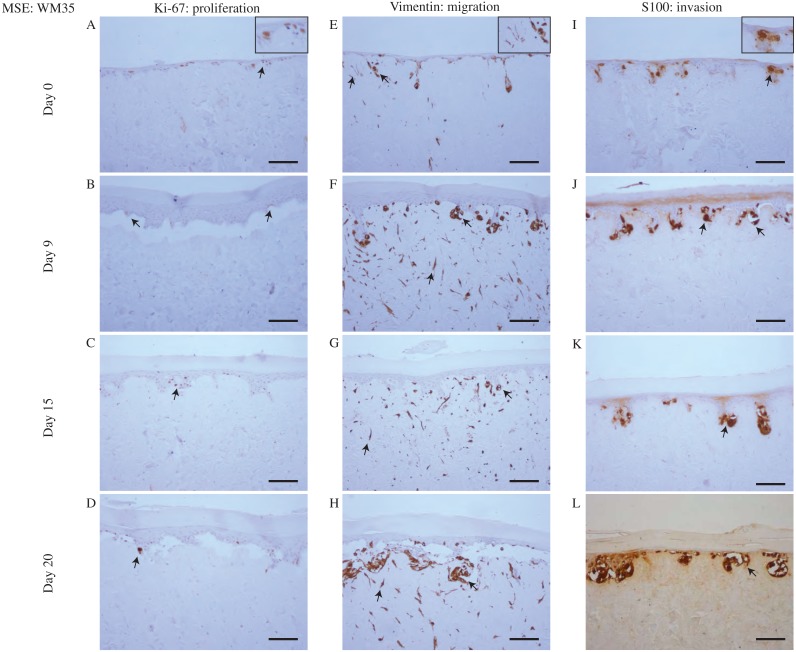
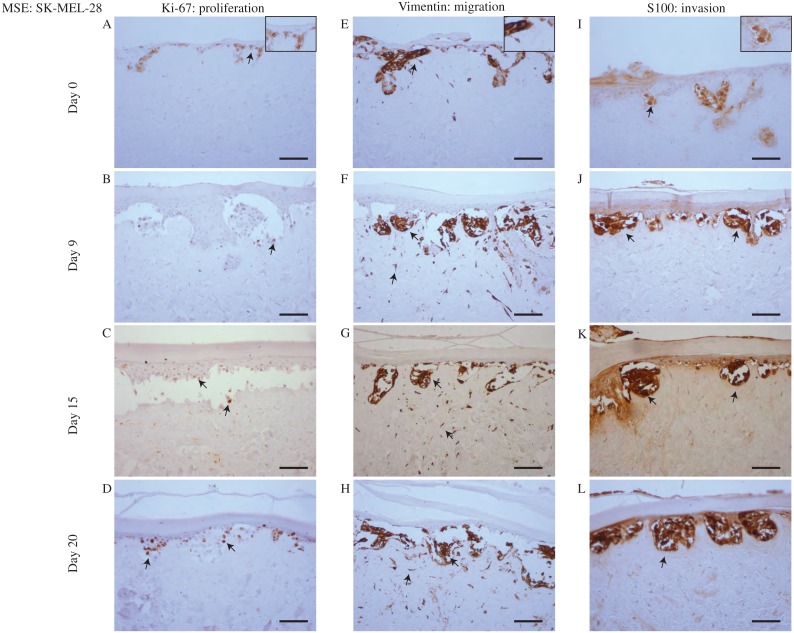
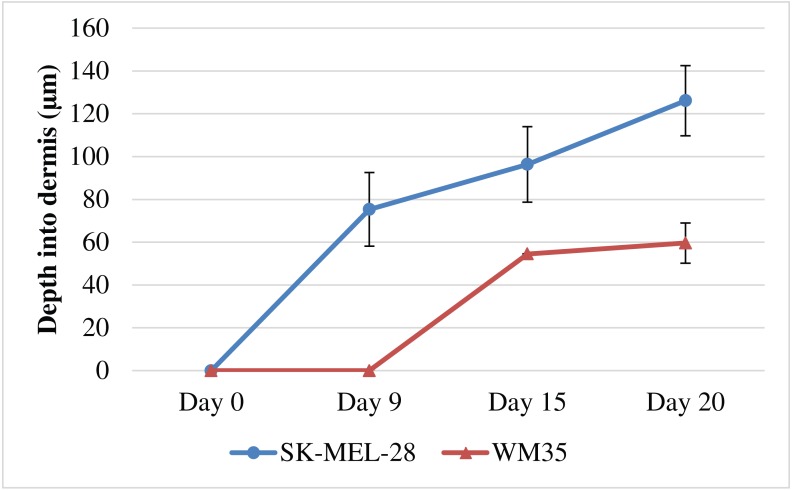
Results: Both HSE and MSE models are similar to native skin in vivo, with a well-defined stratification of the epidermis that is separated from the dermis by a basement membrane. In the HSE and MSE we find fibroblast cells confined to the dermis, and differentiated keratinocytes in the epidermis. In the MSE, melanoma cells form colonies in the epidermis during the early part of the experiment. In the later stage of the experiment, the melanoma cells in the MSE invade deeper into the tissues. Interestingly, both the WM35 and SK-MEL-28 melanoma cells lead to a breakdown of the basement membrane and eventually enter the dermis. However, these two cell lines invade at different rates, with the SK-MEL-28 melanoma cells invading faster than the WM35 cells.
Discussion: The MSE and HSE models are a reliable platform for studying melanoma invasion in a 3D tissue that is similar to native human skin. Interestingly, we find that the WM35 cell line, that is thought to be associated with radial spreading only, is able to invade into the dermis. The vertical invasion of melanoma cells into the dermal region appears to be associated with a localised disruption of the basement membrane. Presenting our results in terms of time course data, along with images and quantitative measurements of the depth of invasion extends previous 3D work that has often been reported without these details.
Keywords: Cancer; Cell line; Cell migration; Invasion; Melanoma; Metastasis; Skin cancer; Skin equivalent model; Skin model; Three dimensional model.
Conflict of interest statement
The authors declare there are no competing interests.
Figures
References
-
- Alexaki VI, Javelaud D, Van-Kempen LCL, Mohammed KS, Dennler S, Luciani F, Hoek KS, Juarez P, Goydos JS, Fournier PJ, Sibon C, Bertolotto C, Verrecchia F, Saule S, Delmas V, Ballotti R, Larue L, Saiag P, Guise TA, Mauviel A. GL12-mediated melanoma invasion and metastasis. Journal of the National Cancer Institute. 2010;102:1148–1159. doi: 10.1093/jnci/djq257. - DOI - PMC - PubMed
-
- Bani MR, Rak J, Adachi D, Wiltshire R, Trent JM, Kerbel RS, Ben-David Y. Multiple features of advanced melanoma recapitulated in tumorigenic variants of early stage (radial growth phase) human melanoma cell lines: evidence for a dominant phenotype. Cancer Research. 1996;56:3075–3086. - PubMed
-
- Baraldi MM, Alemi AA, Sethna JP, Caracciolo S, Porta CALM, Zapperi S. Growth and form of melanoma colonies. Journal of Statistical Mechanics: Theory and Experiment. 2013;2013:p02032. doi: 10.1088/1742-5468/2013/02/P02032. - DOI
LinkOut - more resources
Full Text Sources
Other Literature Sources
