. 2017 Oct 2;127(10):3796-3809.
doi: 10.1172/JCI91561. Epub 2017 Sep 11.

NF-κB regulates GDF-15 to suppress macrophage surveillance during early tumor development

Affiliations

NF-κB regulates GDF-15 to suppress macrophage surveillance during early tumor development

Nivedita M Ratnam et al. J Clin Invest. .

Abstract

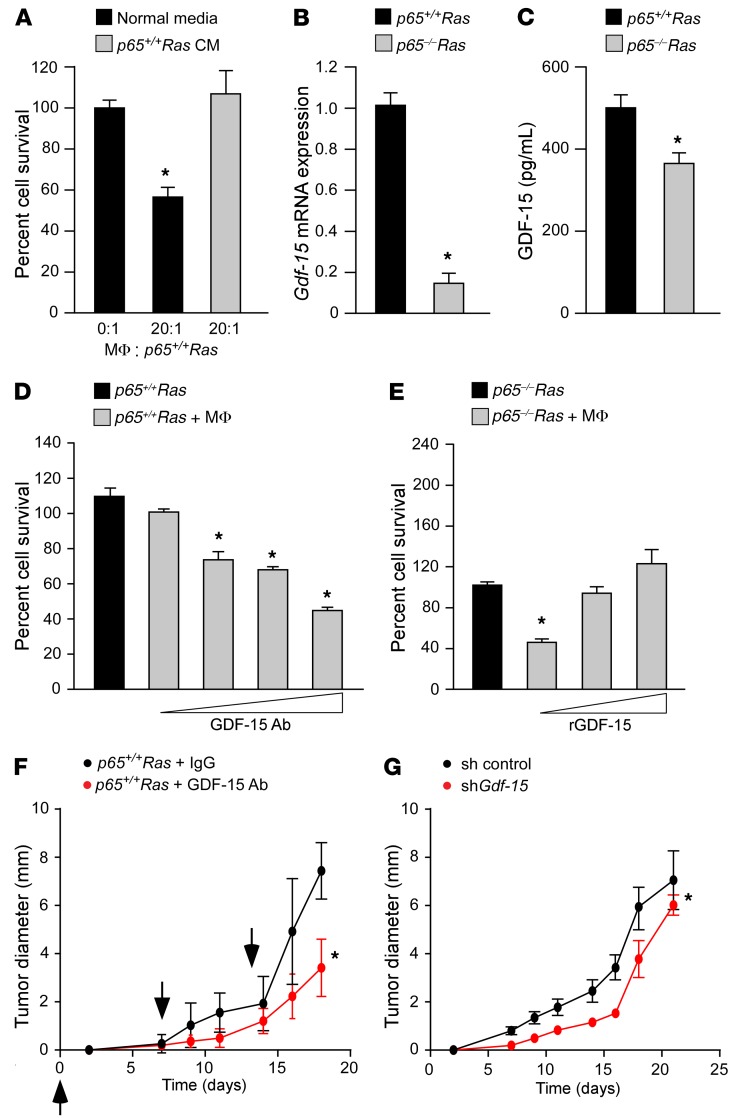
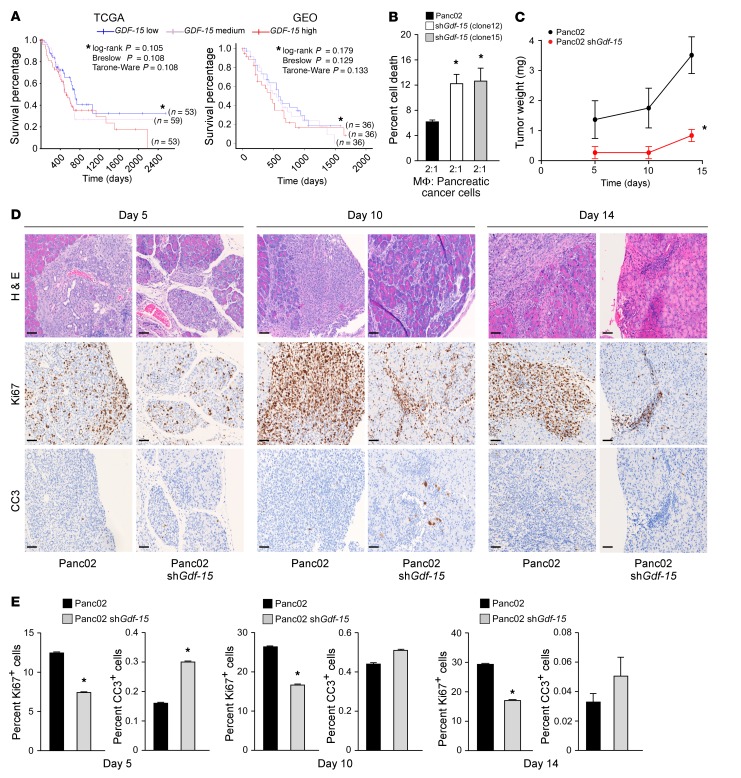
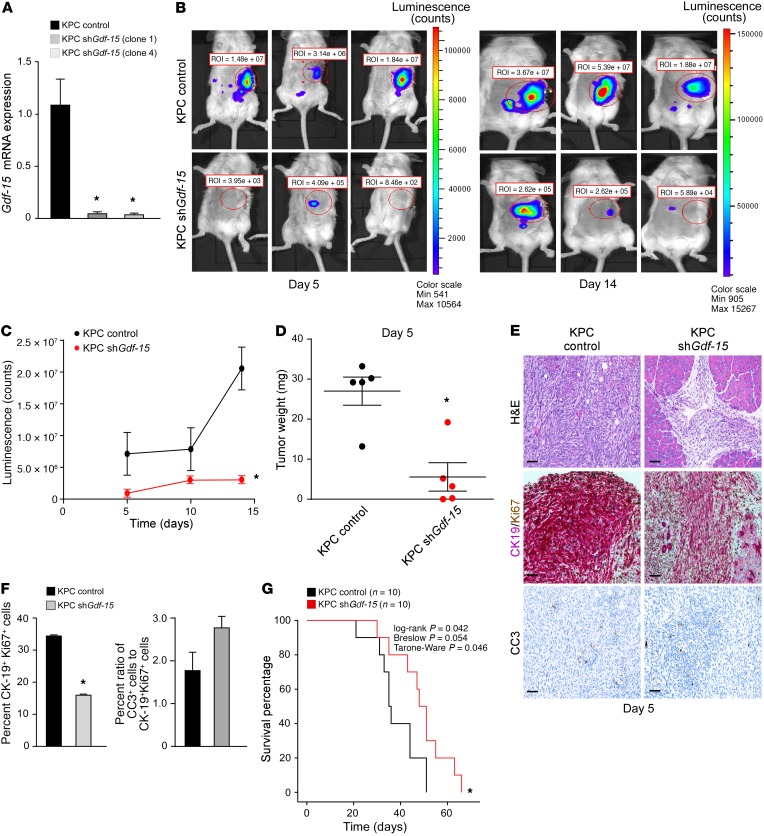
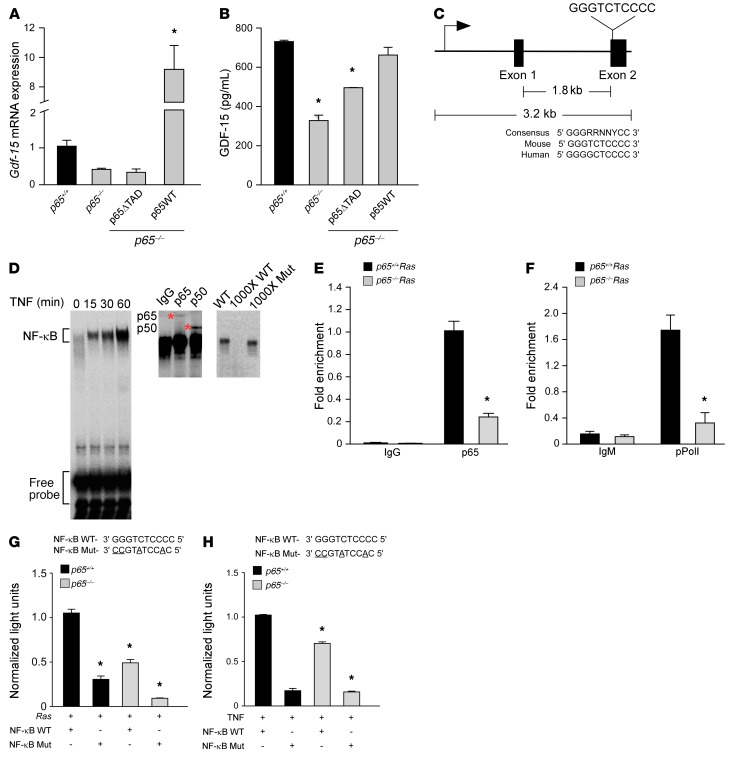
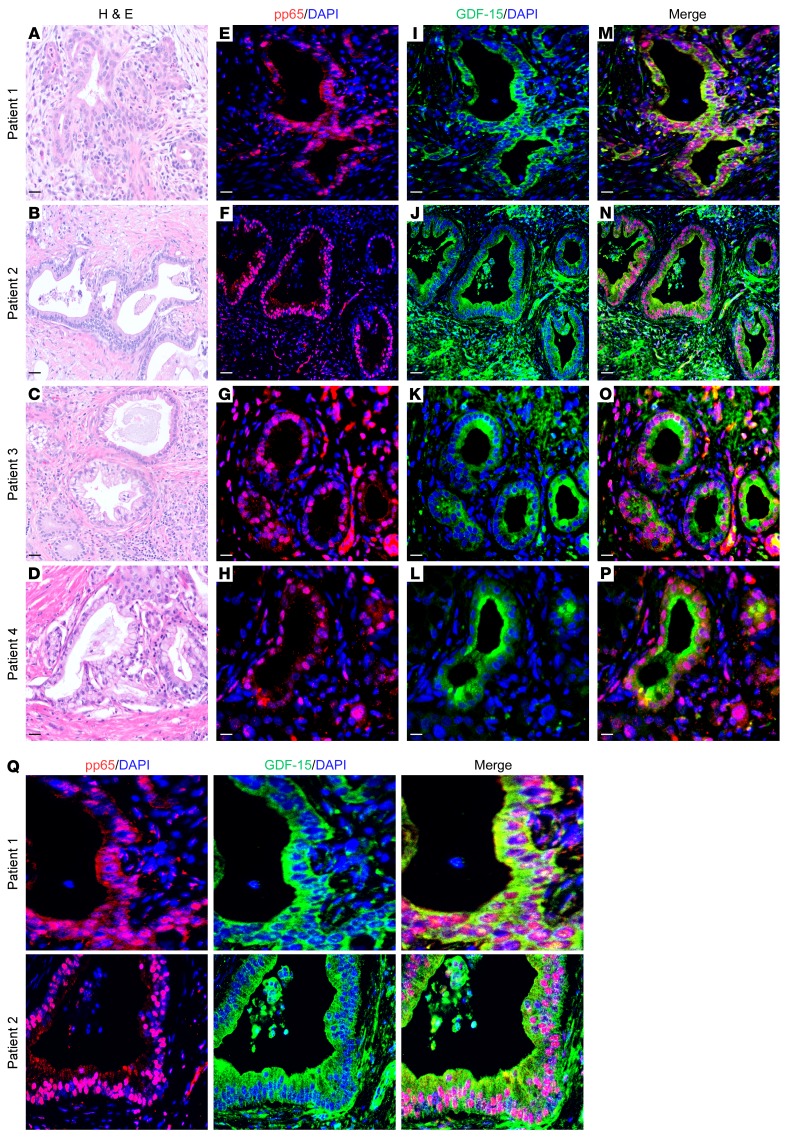
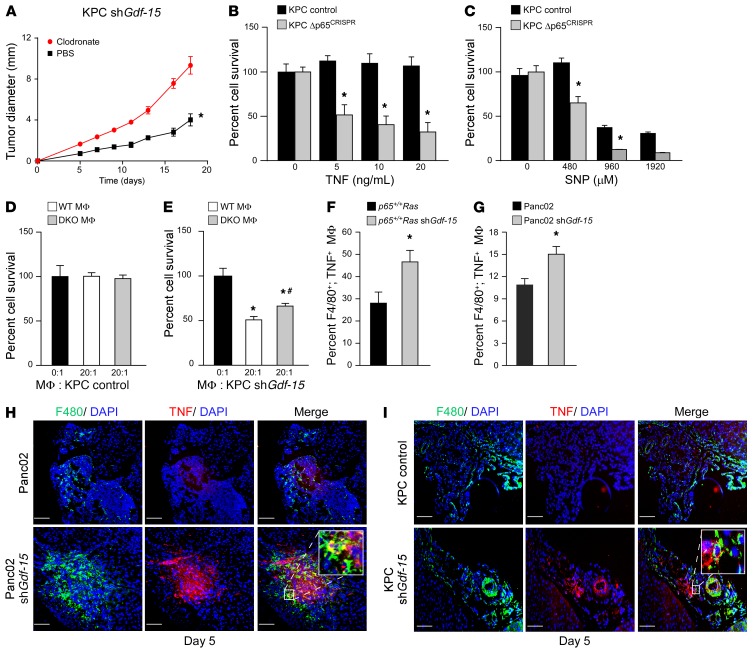
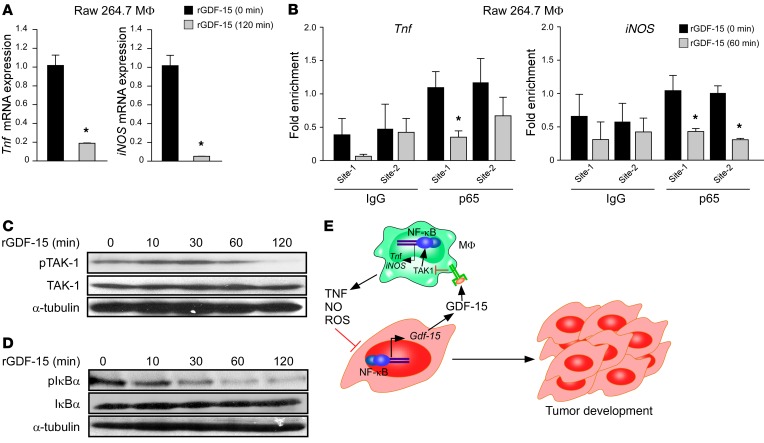
Macrophages are attracted to developing tumors and can participate in immune surveillance to eliminate neoplastic cells. In response, neoplastic cells utilize NF-κB to suppress this killing activity, but the mechanisms underlying their self-protection remain unclear. Here, we report that this dynamic interaction between tumor cells and macrophages is integrally linked by a soluble factor identified as growth and differentiation factor 15 (GDF-15). In vitro, tumor-derived GDF-15 signals in macrophages to suppress their proapoptotic activity by inhibiting TNF and nitric oxide (NO) production. In vivo, depletion of GDF-15 in Ras-driven tumor xenografts and in an orthotopic model of pancreatic cancer delayed tumor development. This delay correlated with increased infiltrating antitumor macrophages. Further, production of GDF-15 is directly regulated by NF-κB, and the colocalization of activated NF-κB and GDF-15 in epithelial ducts of human pancreatic adenocarcinoma supports the importance of this observation. Mechanistically, we found that GDF-15 suppresses macrophage activity by inhibiting TGF-β-activated kinase (TAK1) signaling to NF-κB, thereby blocking synthesis of TNF and NO. Based on these results, we propose that the NF-κB/GDF-15 regulatory axis is important for tumor cells in evading macrophage immune surveillance during the early stages of tumorigenesis.


Conflict of interest statement

Conflict of interest: The authors have declared that no conflict of interest exists.

Figures

Figure 1
Figure 1. GDF-15 protects transformed cells against macrophages and promotes tumor development in vivo.
(A) p65–/–Ras MEFs were cocultured with peritoneal macrophages (MΦ) with normal or conditioned media from p65+/+Ras MEFs. Graph represents cell survival scored by trypan blue exclusion, normalized to untreated p65–/–Ras MEFs. n = 6. Data are shown as mean ± SEM. *P ≤ 0.05, 1-way ANOVA. (B) Gdf-15 analyzed by qRT-PCR in Ras MEFs normalized to Gapdh ± SEM. *P ≤ 0.05, Student’s t test. n = 3. (C) GDF-15 ELISA from Ras MEF–conditioned media. n = 3. Data are shown as mean ± SEM. *P ≤ 0.05, Student’s t test. (D) Ras MEFs were cocultured with macrophages and GDF-15–neutralizing antibody (GDF-15 Ab) at concentrations of 0, 25, 625, and 2,500 ng/ml. Graph represents cell survival similar to that shown in A. Data are shown as mean ± SEM from 2 independent experiments, each performed in triplicate. *P ≤ 0.05, 1-way ANOVA. (E) p65–/–Ras MEFs were cocultured with macrophages and recombinant GDF-15 (rGDF-15) at concentrations of 0, 5, and 10 ng/ml. Graph represents cell survival similar to that shown in A. Data represent mean ± SEM derived from 2 independent experiments, each performed in triplicate. *P ≤ 0.05, 1-way ANOVA. (F) p65+/+Ras MEFs (1 × 10⁶) were injected subcutaneously into SCID mice. Cohorts of mice (n = 5) were intravenously injected with GDF-15 antibody (20 μg/mouse) or IgG control (20 μg/mouse) and tumor sizes measured. Arrowheads indicate time points for injections. Data are shown as mean ± SEM. *P ≤ 0.05, SPSS repeated measures, general linear model. (G) Single clones from Ras MEFs expressing Gdf-15 shRNA or scrambled control (sh control) were subcutaneously injected into SCID mice and tumor sizes measured. Data represent mean tumor diameter from 2 single clones (Scr-1 and Scr-2 for scrambled controls and C2 and D2 for Gdf-15–knockdown) injected into 5 mice each. Data are shown as mean ± SEM. *P ≤ 0.05, SPSS repeated measures, general linear model.
Figure 2
Figure 2. GDF-15 is required for early development of Panc02 tumors.
(A) Kaplan-Meier curve assessing the effects of GDF-15 expression on patient survival obtained from 165 patients in TCGA and 108 patients from a published study on the GEO database (ref. 13). Blue line represents PDAC patients with low GDF-15 expression, white line represents patients with medium GDF-15, and red line indicates patients with high GDF-15. Asterisks compare GDF-15 high and low groups. (B) Panc02 cells expressing an shRNA against Gdf-15 (2 clones, numbers 12 and 15) were cocultured with peritoneal macrophages for 48 hours. The cells were then stained for annexin V, 7-AAD, and CD11b and analyzed by flow cytometry. CD11b cells positive for annexin V, 7-AAD, or both were graphed as percentage of cell death. Data represent mean ± SEM from 2 individual experiments, performed in triplicate. *P ≤ 0.05, 1-way ANOVA. (C) Panc02 control and Panc02 Gdf-15–knockdown cells (described above as clone 12) were injected orthotopically into the tail of the pancreas in C57BL/6 mice. Tumor weight was measured as weight of pancreas with tumor minus average weight of Matrigel-injected pancreas. Data represent the average tumor weight from cohorts of 5 to 7 mice per group per time point ± SEM. *P ≤ 0.05, SPSS repeated measures, general linear model. (D) Control and Gdf-15–knockdown orthotopic tumors described in C were sectioned and analyzed for H&E, Ki67, and CC3. Original magnification, ×20. Scale bars: 15 μm. (E) Ki67 and CC3 staining was quantitated and graphed from 5 mice per condition at each time point, from 5 random fields of view of the tumor area per mouse. Mean ± SEM. *P ≤ 0.05, Student’s t test.
Figure 3
Figure 3. GDF-15 is required for development of KRas-induced PDAC.
(A) KPC cells expressing an shRNA against Gdf-15 were generated (2 clones, 1 and 4). Data are plotted as average gene expression (normalized to Gapdh) ± SEM. n = 3. *P ≤ 0.05, Student’s t test. (B) KPC control and KPC Gdf-15–knockdown cells (described above as clone 1) were injected orthotopically into the tail of the pancreas in C57BL/6 albino mice. Tumor growth was tracked by bioluminescence imaging. Shown are representative images tracking tumor growth of the mice. (C) The graph represents tumor growth derived from bioluminescence measured in B. n = 6 per cohort. Data are shown as mean ± SEM. *P ≤ 0.05, SPSS repeated measures, general linear model. (D) KPC control and KPC Gdf-15–knockdown cells (described above as clone 1) were injected orthotopically into the tail of the pancreas in C57BL/6 albino mice. The graph represents the average weight of tumors obtained from cohorts of 5 mice per condition similar to what is shown in Figure 2C. *P ≤ 0.05, Student’s t test. (E) Control and Gdf-15–knockdown orthotopic tumors were analyzed for H&E, CK19, and Ki67 colocalization and CC3. Original magnification, ×20. Scale bar: 15 μm. (F) CK19 (cytoplasmic, pink)/ Ki67 (nuclear, brown) dual staining was quantitated and graphed from 5 mice per condition from at least 5 fields of view of the tumor area per mouse. Data are shown as mean ± SEM. *P ≤ 0.05, Student’s t test. For CC3 staining, quantitation from staining signal was graphed as a ratio of the percentage of CC3+ cells to the percentage average of proliferating cells. Data are shown as mean ± SEM. Student’s t test, NS. (G) Kaplan-Meier curve assessing survival of C57BL/6 albino mice (n = 10 per cohort) injected with either KPC control or KPC Gdf-15–knockdown cells.
Figure 4
Figure 4. NF-κB is a direct regulator of Gdf-15.
(A) p65–/– MEFs were infected with retrovirus for full-length (p65WT) or truncated p65 (p65ΔTAD). Gdf-15 expression by qRT-PCR was assayed following TNF treatment (5 ng/ml) for 2 hours. n = 3. Data are shown as mean ± SEM. *P ≤ 0.005, 1-way ANOVA. (B) ELISA from conditioned media from transfected cells in A. n = 3. Data are shown as mean ± SEM. *P ≤ 0.05, 1-way ANOVA. (C) Schematic of Gdf-15 gene with NF-κB consensus site in exon 2, compared with consensus site in mouse and human. (D) EMSA from TNF-treated Ras MEFs using NF-κB consensus site probe shown in C. Supershift assay from Ras MEFs incubated with antisera specific for p65 and p50. Asterisks indicate supershifted complexes. Specificity of the complexes was tested by adding ×1000 molar excess of labeled WT probe or nonlabeled mutant probe. (E) ChIP assays for p65 binding from Ras MEFs. DNA was amplified with oligonucleotides spanning the NF-κB site on exon 2 of Gdf-15. Fold enrichment over IgG controls (normalized to input) are indicated. n = 3. *P ≤ 0.05, Student’s t test. (F) ChIP for pPol II (serine 2 version), as described in Figure 4E. DNA was amplified with the same oligonucleotides as shown in E. Fold enrichment over IgM controls (normalized to input) are indicated. n = 3. *P ≤ 0.05. Student’s t test. (G) MEFs were transfected with a luciferase reporter with WT or mutated NF-κB consensus sites, as shown in C. Cells were cotransfected with H-RasG12V, and after 48 hours, luciferase activity was measured. n = 3. *P ≤ 0.05 compared with p65+/+ MEFs with WT construct+ H-Ras, 2-way ANOVA. (H) MEFs were transfected with WT and mutant luciferase reporters and treated with 1 μl/ml of TNF for 2 hours. Luciferase activity was measured. n = 3. *P ≤ 0.05 when compared with p65+/+ MEFs with WT construct with TNF, 2-way ANOVA.
Figure 5
Figure 5. NF-κB and GDF-15 expression is colocalized in human PDAC cells.
(A) Representative images for 4 patient samples with histologically confirmed PDAC. (AD) H&E images; (EH) immunofluorescence staining for pp65 (nuclear stain) and nuclei counterstained with DAPI; (IL) immunofluorescence staining for GDF-15 (cytoplasmic stain) and nuclei counterstained with DAPI; (MP) merged images of pp65, GDF-15, and DAPI staining. (Q) Magnified images show colocalization of nuclear pp65 and cytoplasmic GDF-15. Original magnification, ×20. Scale bars: 15 μm (AD); 100 μm (EQ).
Figure 6
Figure 6. GDF-15 suppresses macrophage cytotoxicity by inhibiting TNF.
(A) KPC Gdf-15–knockdown cells were injected into mice and treated with clodronate liposomes or control liposomes biweekly. Tumor sizes were measured. n = 5 per cohort. Data are shown as mean ± SEM. *P ≤ 0.05, SPSS repeated measures, general linear model. (B and C) MTS assay following TNF and SNP treatment of KPC control and Δp65CRISPR cells. Data represent the mean of 2 independent experiments performed in triplicate. *P ≤ 0.05, 2-way ANOVA. (D and E) KPC control and Gdf-15–knockdown cells were cocultured with WT or Tnf and iNOS DKO macrophages. Graph represents cell survival. n = 6. Data are shown as mean ± SEM. *P ≤ 0.05 compared with 0:1; #P ≤ 0.05 compared with 20:1 WT macrophages, 1-way ANOVA. (F) Ras MEFs knockdown for Gdf-15 were injected into SCID mice, and macrophages were harvested and analyzed by FACS for F4/80+ and TNF+. Graph represents mean ± SEM of F4/80+; TNF+ double-positive cells from 6 mice in 2 independent experiments. *P ≤ 0.05, Student’s t test. (G) FACS analysis similar to F performed on SCID mice (n = 5 for each group) following intraperitoneal injections with Panc02 control and Gdf-15–knockdown cells. Graph represents mean ± SEM of F4/80+; TNF+ double-positive macrophages. *P ≤ 0.05, Student’s t test. (H) Immunohistochemistry on tumors following injections of Panc02 control and Gdf-15–knockdown cells. Tumors were harvested, sectioned, and stained for F4/80 and TNF and nuclei counterstained with DAPI. Inset represents magnified image of F4/80+, TNF+ macrophages in Gdf-15–knockdown Panc02 tumors. (I) Tumors harvested from KPC control and Gdf-15 shRNA–injected C57BL/6 albino mice 5 days after injection were sectioned and stained in the same way as the Panc02 cells. Inset represents magnified image of F4/80+, TNF+ macrophages in Gdf-15–knockdown KPC tumors. Original magnification, ×20. Magnification in insets ×20. Scale bar: 100 μm.
Figure 7
Figure 7. GDF-15 signals in macrophages to suppress NF-κB signaling via TAK1.
(A) Raw 264.7 macrophages were treated with 5 ng/ml of rGDF-15 for 120 minutes, and then Tnf and iNOS expression was quantitated by qRT-PCR. n = 3. *P ≤ 0.05, Student’s t test. (B) ChIPs were performed on chromatin from Raw 264.7 macrophages treated with rGDF-15 for 60 minutes. Precipitated DNA was amplified with oligonucleotides spanning each of the 2 NF-κB consensus sites on the promoters of the respective Tnf and iNOS genes. Fold enrichment over IgG controls and normalized to input are indicated. n = 3 each. *P ≤ 0.05, Student’s t test. (C) Western blot was performed from Raw 264.7 macrophages treated with 5 ng/ml rGDF-15, and cell lysates were probed for pTAK1 and total TAK1. α-Tubulin was used as a loading control. (D) Similar to C, except that cell lysates were probed for IκBα phosphorylation and total IκBα with α-tubulin served as a loading control. (E) A model for how NF-κB regulates macrophage immune surveillance through GDF-15. The diagram shows that tumor cells utilize NF-κB for protection against infiltrating macrophages. Macrophages mediate this surveillance response through the secretion of proapoptotic factors TNF, NO, and ROS, but tumor-derived NF-κB overcomes these proapoptotic factors by synthesizing and secreting GDF-15, which signals in macrophages to suppress the production of TNF and NO, in turn inhibiting NF-κB signaling in the macrophages.

Similar articles

Cited by

References

    1. Hanahan D, Weinberg RA. The hallmarks of cancer. Cell. 2000;100(1):57–70. doi: 10.1016/S0092-8674(00)81683-9. - DOI - PubMed
    1. Ribatti D. The concept of immune surveillance against tumors. The first theories. Oncotarget. 2017;8(4):7175–7180. - PMC - PubMed
    1. Colotta F, Allavena P, Sica A, Garlanda C, Mantovani A. Cancer-related inflammation, the seventh hallmark of cancer: links to genetic instability. Carcinogenesis. 2009;30(7):1073–1081. doi: 10.1093/carcin/bgp127. - DOI - PubMed
    1. Beatty GL, et al. CD40 agonists alter tumor stroma and show efficacy against pancreatic carcinoma in mice and humans. Science. 2011;331(6024):1612–1616. doi: 10.1126/science.1198443. - DOI - PMC - PubMed
    1. Davies LC, Jenkins SJ, Allen JE, Taylor PR. Tissue-resident macrophages. Nat Immunol. 2013;14(10):986–995. doi: 10.1038/ni.2705. - DOI - PMC - PubMed

MeSH terms