Clinical Trial
. 2017 Oct 2;127(10):3827-3834.
doi: 10.1172/JCI94582. Epub 2017 Sep 11.

No evidence of HIV replication in children on antiretroviral therapy

Affiliations
Clinical Trial

No evidence of HIV replication in children on antiretroviral therapy

Gert U Van Zyl et al. J Clin Invest. .

Abstract

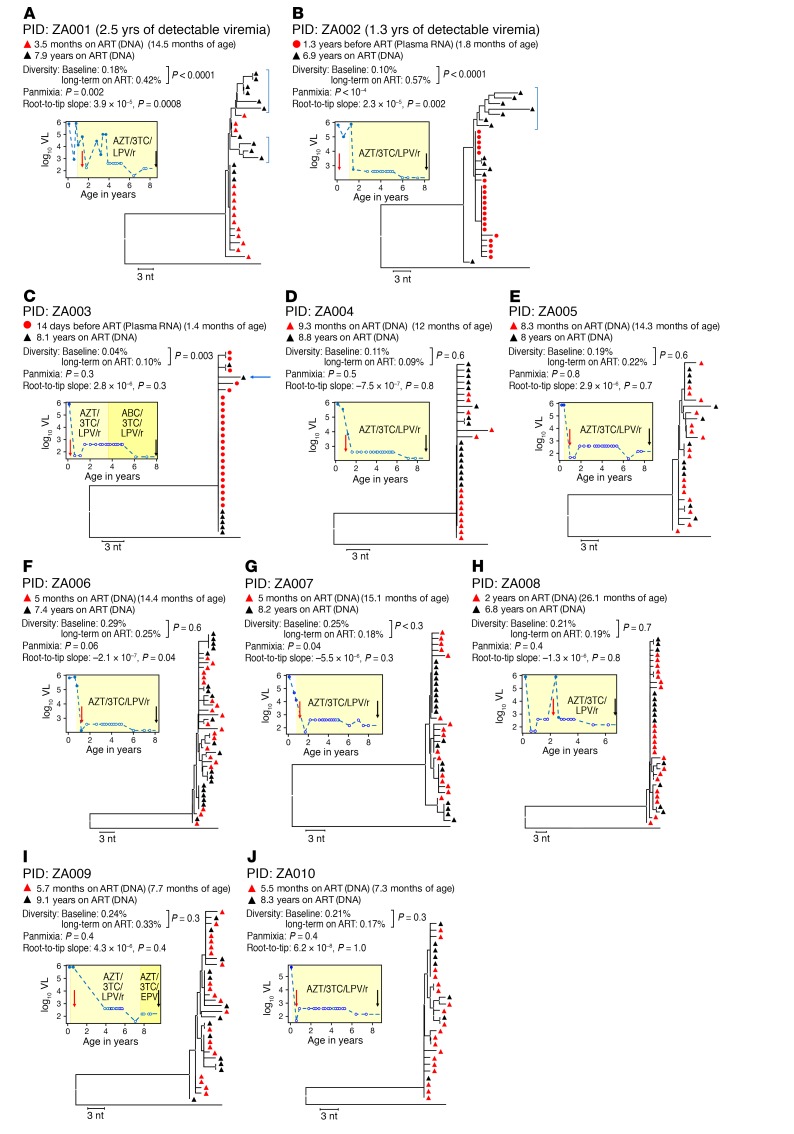
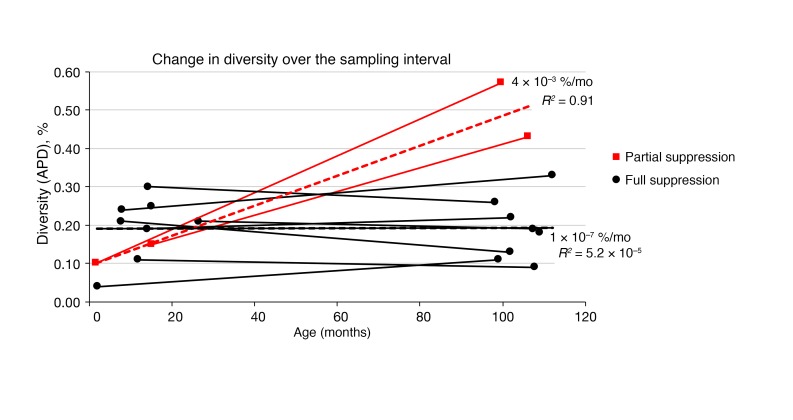
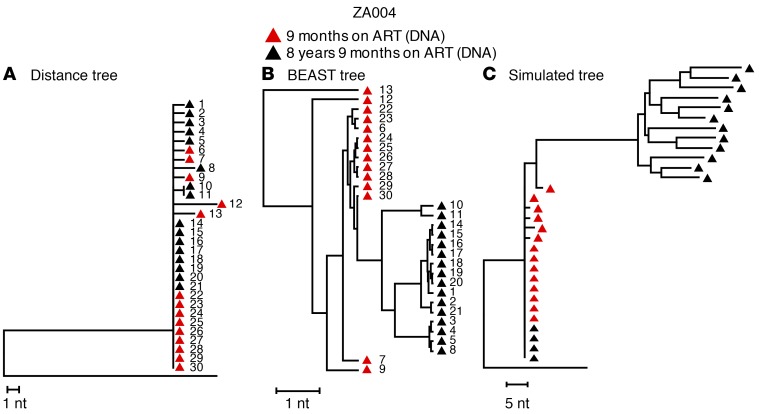
It remains controversial whether current antiretroviral therapy (ART) fully suppresses the cycles of HIV replication and viral evolution in vivo. If replication persists in sanctuary sites such as the lymph nodes, a high priority should be placed on improving ART regimes to target these sites. To investigate the question of ongoing viral replication on current ART regimens, we analyzed HIV populations in longitudinal samples from 10 HIV-1-infected children who initiated ART when viral diversity was low. Eight children started ART at less than ten months of age and showed suppression of plasma viremia for seven to nine years. Two children had uncontrolled viremia for fifteen and thirty months, respectively, before viremia suppression, and served as positive controls for HIV replication and evolution. These latter 2 children showed clear evidence of virus evolution, whereas multiple methods of analysis bore no evidence of virus evolution in any of the 8 children with viremia suppression on ART. Phylogenetic trees simulated with the recently reported evolutionary rate of HIV-1 on ART of 6 × 10⁻⁴ substitutions/site/month bore no resemblance to the observed data. Taken together, these data refute the concept that ongoing HIV replication is common with ART and is the major barrier to curing HIV-1 infection.


Conflict of interest statement

Conflict of interest: J.W. Mellors is a consultant for Gilead Sciences Inc., a shareholder of Cocrystal Pharma Inc., and has received research support from Gilead Sciences Inc. and Janssen Pharmaceuticals Inc.

Figures

Figure 1
Figure 1. Properties of HIV-1 infection in the 10 children studied.
HIV sequence diversity was measured as the APD at the indicated time points. Divergence was measured using a test for panmixia, with a P value of less than 0.001 considered significant after correcting for multiple comparisons (8), and by measuring the root-to-tip distances of sequences on phylogenetic trees (longer branches over time indicate viral evolution). A 1-sample t test was used to determine if there was a significant change in APD on ART, and a 2-tailed F test was used to determine whether the root-to-tip slopes were significantly different from 0. All branches are shown as the p-distance in the NJ trees. Baseline HIV sequences were either from PBMC DNA (red triangles) or plasma RNA (red circles), and sequences for long-term ART were all from PBMC DNA (black triangles), sampled at the indicated time points. Blue brackets show sequences with evidence of HIV evolution. Plots to the left of the trees show the plasma HIV RNA viral load (VL) as a function of age. Red and black arrows on the plots indicate the time of collection of samples analyzed by SGS. Red vertical arrows indicate the patient’s age at ART initiation. White symbols indicate samples with an undetectable VL, plotted at the limit of sensitivity of the assay used. The apparent decline in the level of undetectable VL in some samples is due to a switch to an assay with a lower limit of detection. (A and B) Patients with detectable viremia for more than 1 year after the time of the first sample. (CJ) Patients with undetectable viremia for all samples taken after the first sample. The blue arrow indicates a sequence that was omitted in 1 sensitivity analysis, as discussed in the text. Results from a total of 20 samples are included in this figure.
Figure 2
Figure 2. HIV-1 diversity as a function of age.
Changes in the APD at baseline compared with 7 to 9 years of viremia suppression on ART. The 2 children with unsuppressed viremia are shown in red and the others in black. The heavy dashed lines show the linear regression for all relevant sequences in aggregate, with the slopes and R2 values indicated. Results from a total of 20 samples are included in this figure.
Figure 3
Figure 3. Comparison of analytical approaches.
(A) NJ tree of the sequences from a child (PID ZA004) who started treatment at less than 3 months of age and had full viremia suppression for 8.9 years (Supplemental Table 1). This tree is identical to that shown in Figure 1D for the same child. Red triangles indicate single-genome DNA sequences obtained 9 months after ART initiation. Black triangles indicate single-genome DNA sequences obtained 8 years later. The distance tree shows that the populations did not shift for 8 years on ART; populations at both time points were almost completely homogeneous, with only 8 nucleotide differences in 16,800 bases at baseline and 9 nucleotide differences in 19,200 bases 8 years later. The founder sequences persisted across the sampling time points. (B) The same sequences analyzed by BEAST using a strict molecular clock (as in ref. 10) show divergence over time, despite the identity of most sequences at both time points. Individual sequences are numbered identically in the 2 trees shown in A and B. (C) Simulated NJ distance tree using the estimated HIV evolution rate of 6.24 × 10⁻⁴ substitutions/site/month from ref. , applying the baseline sequences from the same child as in A and B. The simulated tree shows artifactual evolution, while the actual tree shows no evidence of sequence divergence after 8 years of ART.

References

    1. Simonetti FR, et al. Clonally expanded CD4+ T cells can produce infectious HIV-1 in vivo. Proc Natl Acad Sci U S A. 2016;113(7):1883–1888. doi: 10.1073/pnas.1522675113. - DOI - PMC - PubMed
    1. Maldarelli F, et al. HIV latency. Specific HIV integration sites are linked to clonal expansion and persistence of infected cells. Science. 2014;345(6193):179–183. doi: 10.1126/science.1254194. - DOI - PMC - PubMed
    1. Kearney MF, et al. Lack of detectable HIV-1 molecular evolution during suppressive antiretroviral therapy. PLoS Pathog. 2014;10(3):e1004010. doi: 10.1371/journal.ppat.1004010. - DOI - PMC - PubMed
    1. Lorenzi JC, et al. Paired quantitative and qualitative assessment of the replication-competent HIV-1 reservoir and comparison with integrated proviral DNA. Proc Natl Acad Sci U S A. 2016;113(49):E7908–E7916. doi: 10.1073/pnas.1617789113. - DOI - PMC - PubMed
    1. Bui JK, et al. Proviruses with identical sequences comprise a large fraction of the replication-competent HIV reservoir. PLoS Pathog. 2017;13(3):e1006283. doi: 10.1371/journal.ppat.1006283. - DOI - PMC - PubMed

Publication types

Substances