

Nrf2 Activation by 5-lipoxygenase Metabolites in Human Umbilical Vascular Endothelial Cells
- PMID: 28892009
- PMCID: PMC5622761
- DOI: 10.3390/nu9091001
Nrf2 Activation by 5-lipoxygenase Metabolites in Human Umbilical Vascular Endothelial Cells
Abstract
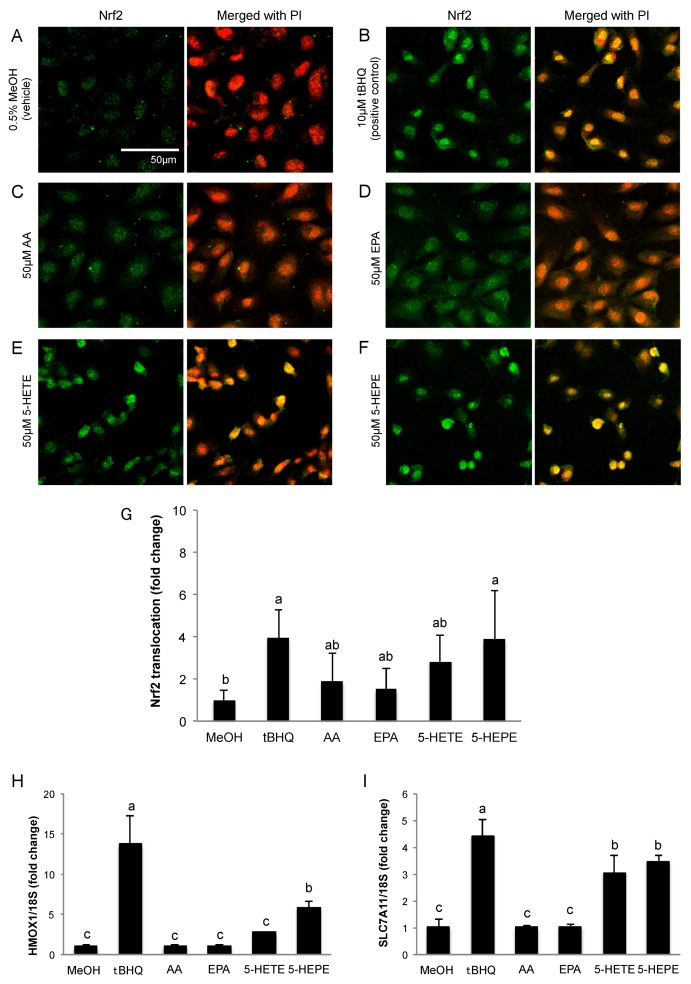
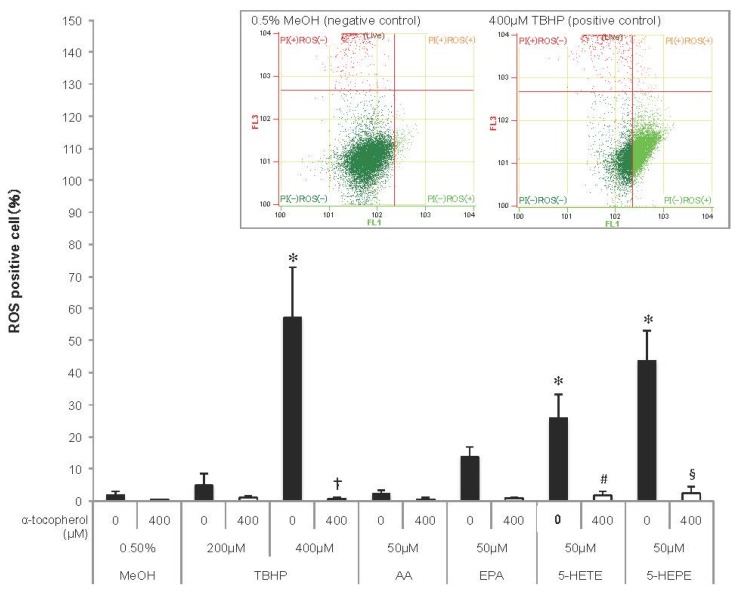
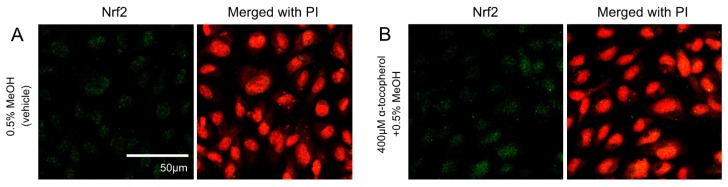
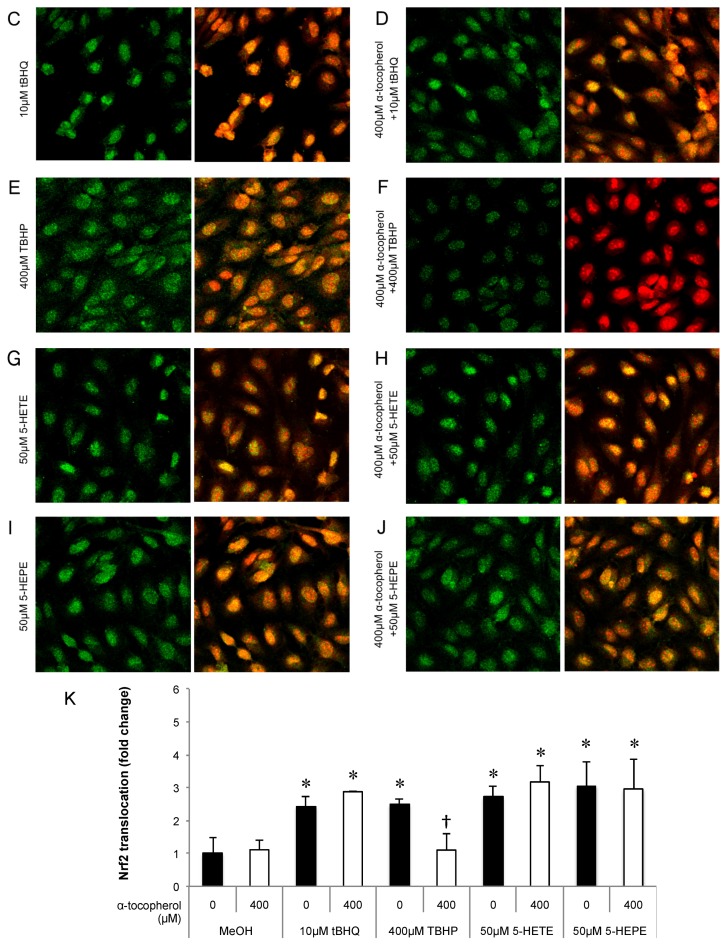
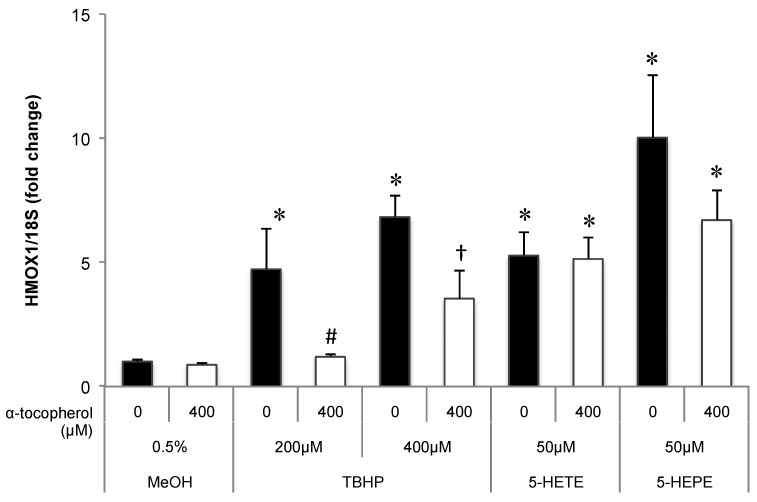
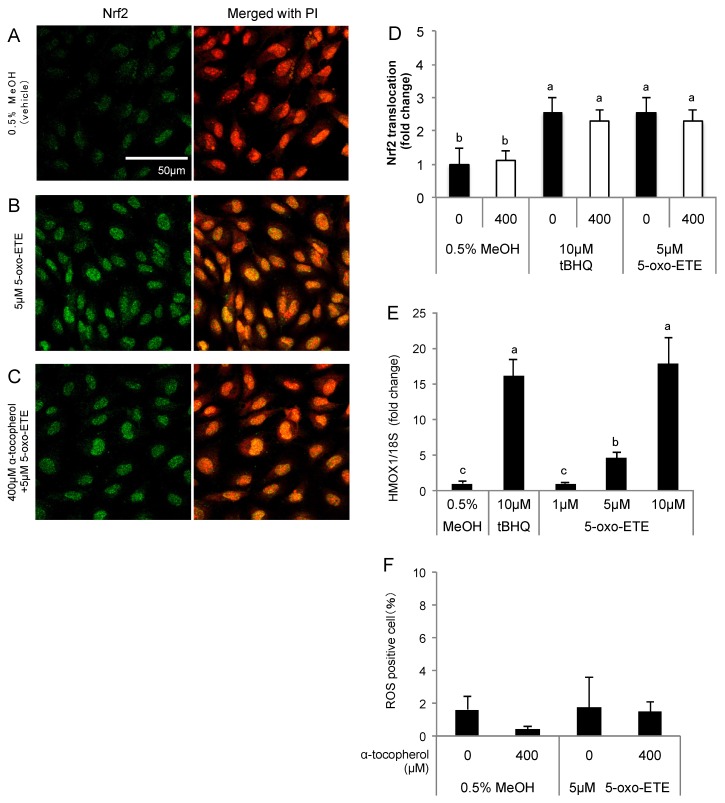
5-hydroxyeicosatetraenoic acid (5-HETE) and 5-hydroxyeicosapentaenoic acid (5-HEPE) are major metabolites produced by 5-lipoxygenase (5-LOX) from arachidonic acid (AA) and eicosapentaenoic acid (EPA). Effects of hydroxides on endothelial cells are unclear, although 5-LOX is known to increase at arteriosclerotic lesions. To investigate the effects of hydroxides on human umbilical vein endothelial cells (HUVECs), the cells were treated with 50 μM each of AA, EPA, 5-HETE, and 5-HEPE. Treatment of HUVECs with 5-HETE and 5-HEPE, rather than with AA and EPA, increased the nuclear translocation of NF-E2 related factor 2 (Nrf2) and upregulated the expression of heme oxygenase-1 and cystine/glutamate transporter regulated by Nrf2. Reactive oxygen species (ROS) generation was markedly elevated in HUVECs after treatment with 5-HETE and 5-HEPE, and the pretreatment with α-tocopherol abrogated ROS levels similar to those in the vehicle control. However, ROS generation was independent of Nrf2 activation induced by 5-HETE and 5-HEPE. 5-HETE was converted to 5-oxo-eicosatetraenoic acid (5-oxo-ETE) in HUVECs, and 5-oxo-ETE increased Nrf2 activation. These results suggest that 5-HETE works as an Nrf2 activator through the metabolite 5-oxo-ETE in HUVECs. Similarly, 5-HEPE works in the same way, because 5-HEPE is metabolized to 5-oxo-eicosapentaenoic acid through the same pathway as that for 5-HETE.
Keywords: 5-hydroxyeicosapentaenoic acid; 5-hydroxyeicosatetraenoic acid; 5-lipoxygenase; 5-oxo-eicosatetraenoic acid; Nrf2; human umbilical vein endothelial cells; reactive oxygen species.
Conflict of interest statement
The authors declare no conflict of interest.
Figures
Similar articles
-
Comparison of the in vitro effect of eicosapentaenoic acid (EPA)-derived lipoxygenase metabolites on human platelet function with those of arachidonic acid.Thromb Res. 1986 Feb 1;41(3):373-84. doi: 10.1016/0049-3848(86)90248-3. Thromb Res. 1986. PMID: 3010490
-
Upregulation of Periostin Prevents High Glucose-Induced Mitochondrial Apoptosis in Human Umbilical Vein Endothelial Cells via Activation of Nrf2/HO-1 Signaling.Cell Physiol Biochem. 2016;39(1):71-80. doi: 10.1159/000445606. Epub 2016 Jun 20. Cell Physiol Biochem. 2016. PMID: 27322610
-
Cyclooxygenase-2-mediated metabolism of arachidonic acid to 15-oxo-eicosatetraenoic acid by rat intestinal epithelial cells.Chem Res Toxicol. 2007 Nov;20(11):1665-75. doi: 10.1021/tx700130p. Epub 2007 Oct 2. Chem Res Toxicol. 2007. PMID: 17910482
-
Biosynthesis, biological effects, and receptors of hydroxyeicosatetraenoic acids (HETEs) and oxoeicosatetraenoic acids (oxo-ETEs) derived from arachidonic acid.Biochim Biophys Acta. 2015 Apr;1851(4):340-55. doi: 10.1016/j.bbalip.2014.10.008. Epub 2014 Oct 29. Biochim Biophys Acta. 2015. PMID: 25449650 Free PMC article. Review.
-
Key Role of 12-Lipoxygenase and Its Metabolite 12-Hydroxyeicosatetraenoic Acid (12-HETE) in Diabetic Retinopathy.Curr Eye Res. 2022 Mar;47(3):329-335. doi: 10.1080/02713683.2021.1995003. Epub 2022 Feb 7. Curr Eye Res. 2022. PMID: 35129022 Review.
Cited by
-
Mitochondrial aldehyde dehydrogenase (ALDH2) rescues cardiac contractile dysfunction in an APP/PS1 murine model of Alzheimer's disease via inhibition of ACSL4-dependent ferroptosis.Acta Pharmacol Sin. 2022 Jan;43(1):39-49. doi: 10.1038/s41401-021-00635-2. Epub 2021 Mar 25. Acta Pharmacol Sin. 2022. PMID: 33767380 Free PMC article.
-
What Is the Impact of Depletion of Immunoregulatory Genes on Wound Healing? A Systematic Review of Preclinical Evidence.Oxid Med Cell Longev. 2020 Dec 7;2020:8862953. doi: 10.1155/2020/8862953. eCollection 2020. Oxid Med Cell Longev. 2020. PMID: 33488938 Free PMC article.
-
Plasma oxylipins in children with sickle cell disease: Associations with biomarkers of inflammation and endothelial activation.Prostaglandins Leukot Essent Fatty Acids. 2025 Jul;205:102670. doi: 10.1016/j.plefa.2025.102670. Epub 2025 Feb 24. Prostaglandins Leukot Essent Fatty Acids. 2025. PMID: 40036911
-
Monascuspiloin from Monascus-Fermented Red Mold Rice Alleviates Alcoholic Liver Injury and Modulates Intestinal Microbiota.Foods. 2022 Sep 30;11(19):3048. doi: 10.3390/foods11193048. Foods. 2022. PMID: 36230124 Free PMC article.
-
Phase 0 of the Xenobiotic Response: Nuclear Receptors and Other Transcription Factors as a First Step in Protection from Xenobiotics.Nucl Receptor Res. 2019;6:101447. doi: 10.32527/2019/101447. Epub 2019 Nov 20. Nucl Receptor Res. 2019. PMID: 31815118 Free PMC article.
References
-
- Calder P.C. n-3 polyunsaturated fatty acids, inflammation, and inflammatory diseases. Am. J. Clin. Nutr. 2006;83:1505S–1519S. - PubMed
MeSH terms
Substances
LinkOut - more resources
Full Text Sources
Other Literature Sources
Research Materials
