Comparative Study
. 2017 Oct;49(10):1421-1427.
doi: 10.1038/ng.3954. Epub 2017 Sep 11.

Linkage disequilibrium-dependent architecture of human complex traits shows action of negative selection

Affiliations
Comparative Study

Linkage disequilibrium-dependent architecture of human complex traits shows action of negative selection

Steven Gazal et al. Nat Genet. 2017 Oct.

Erratum in

Abstract

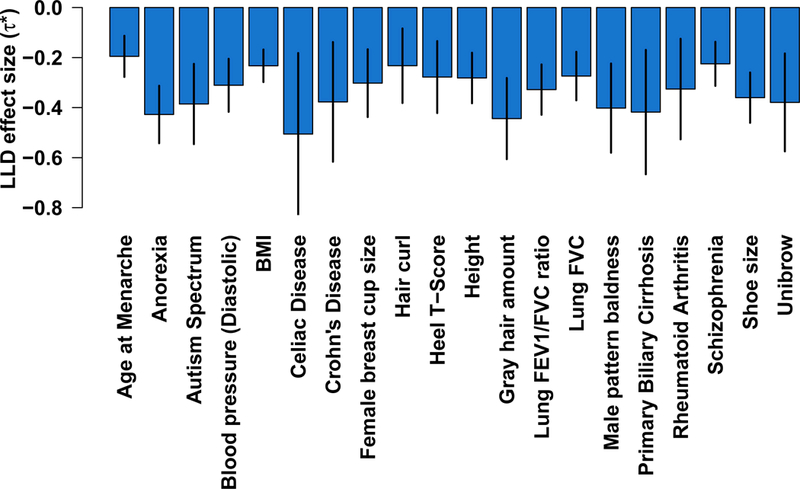
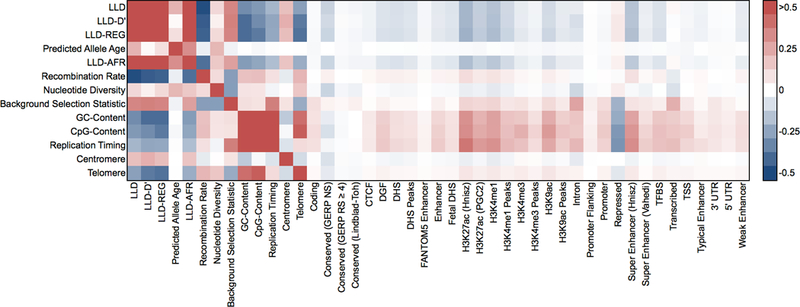
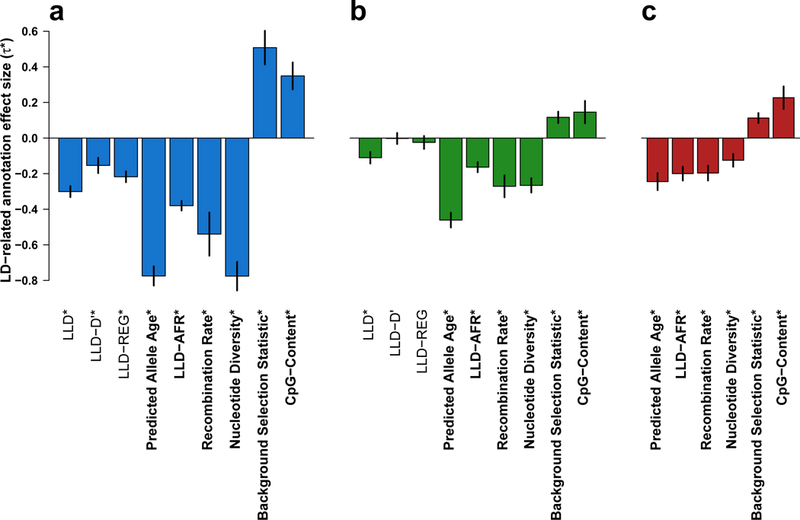
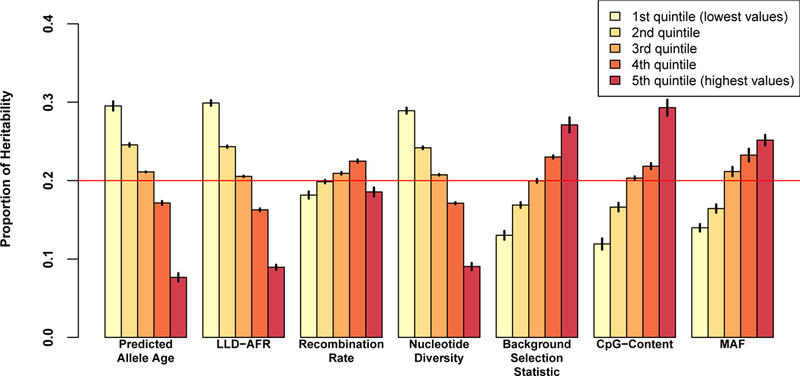
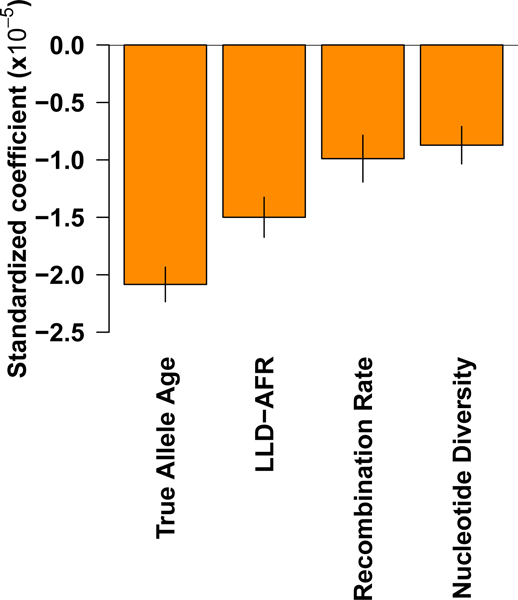
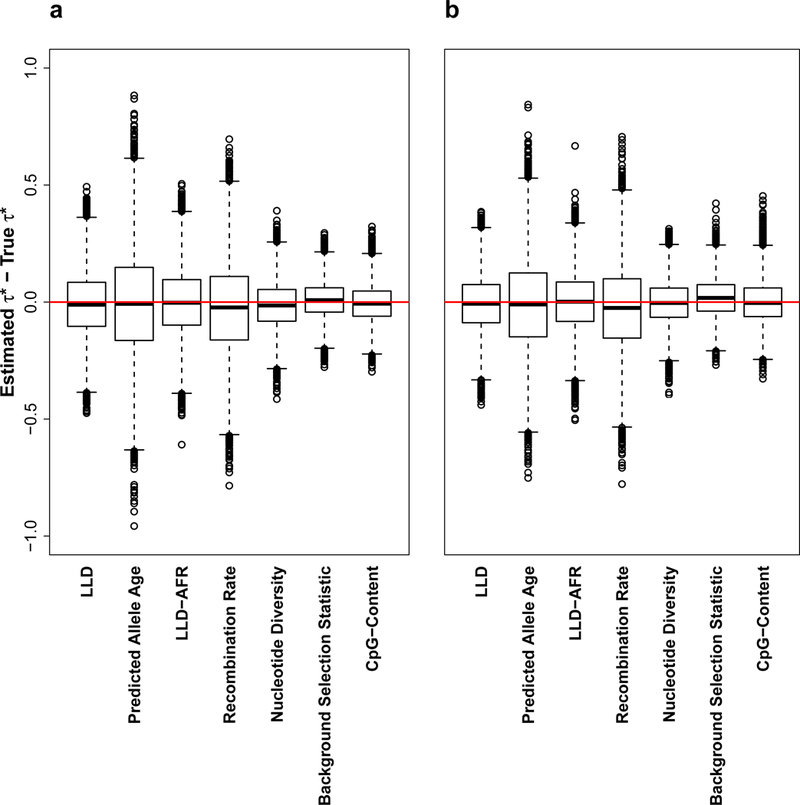
Recent work has hinted at the linkage disequilibrium (LD)-dependent architecture of human complex traits, where SNPs with low levels of LD (LLD) have larger per-SNP heritability. Here we analyzed summary statistics from 56 complex traits (average N = 101,401) by extending stratified LD score regression to continuous annotations. We determined that SNPs with low LLD have significantly larger per-SNP heritability and that roughly half of this effect can be explained by functional annotations negatively correlated with LLD, such as DNase I hypersensitivity sites (DHSs). The remaining signal is largely driven by our finding that more recent common variants tend to have lower LLD and to explain more heritability (P = 2.38 × 10-104); the youngest 20% of common SNPs explain 3.9 times more heritability than the oldest 20%, consistent with the action of negative selection. We also inferred jointly significant effects of other LD-related annotations and confirmed via forward simulations that they jointly predict deleterious effects.


Conflict of interest statement

Competing Financial Interests

N.A.F. is an employee of 23andMe Inc. (Mountain View, CA).

Figures

Figure 1:
Figure 1:. Effect size of MAF-adjusted level of LD (LLD) on 20 highly heritable complex traits.
Results are displayed for 20 traits with the highest SNP-heritability (subject to low genetic correlation between traits). Numerical results for all 56 complex traits are reported in Supplementary Table 2. Error bars represent jackknife 95% confidence intervals.
Figure 2:
Figure 2:. Correlations between LD-related and functional annotations.
We report correlations computed on common SNPs (MAF ≥ 5%). LLD, LLD-D’, LLD-REG, predicted allele age and LLD-AFR annotations are MAF-adjusted. Numerical results are reported in Supplementary Table 4.
Figure 3:
Figure 3:. Effect size of LD-related annotations meta-analyzed over 31 independent traits.
(a) Meta-analysis results for 9 LD-related annotations. (b) Meta-analysis results for nine LD-related annotations, conditioned on baseline model. (c) Meta-analysis results for six LD-related annotations conditioned on each other and on baseline model. Results are displayed for the six LD-related annotations that are jointly significant when conditioned on each other and on the baseline model (see (c)). In (a) and (b) only, results are also displayed for the remaining LLD annotations. Numerical results for all annotations analyzed are reported in Supplementary Table 3 for (a) and (b), and Supplementary Table 8 for (c). Numerical results for all 56 complex traits are reported in Supplementary Table 2 for (a), Supplementary Table 7 for (b), and Supplementary Table 9 for (c). Asterisks indicate significance at P < 0.05 after Bonferroni correction (0.05/43, 0.05/43, and 0.05/6 for (a), (b), (c), respectively). Error bars represent 95% confidence intervals.
Figure 4:
Figure 4:. Proportion of heritability explained by the quintiles of each LD-related annotation, meta-analyzed over 31 independent traits.
We report results for each LD-related annotation of the baseline-LD model, and for MAF for comparison purposes. Numerical results are reported in Supplementary Table 12. Results for all 56 complex traits are reported in Supplementary Figure 9 and Supplementary Table 9. Error bars represent jackknife standard errors around the enrichment estimates. The red line indicates the proportion of heritability when there is no enrichment (20% of SNPs explain 20% of heritability).
Figure 5:
Figure 5:. Forward simulations confirm that LD-related annotations predict deleterious effects.
We report standardized coefficients for each of four LD-related annotations in a joint regression of absolute selection coefficient against these annotations in data from forward simulations (see text). Numerical results are reported in Supplementary Table 15. Error bars represent 95% confidence intervals around the regression coefficient estimates.
Figure 6:
Figure 6:. Simulations to assess extension of stratified LD score regression to continuous LD-related annotations.
We report bias (estimated vs. true 𝜏*) across 10,000 simulations for (a) Null simulations with MAF-dependent architecture and (b) Causal simulations with MAF+LD-dependent architecture. Results for null simulations with MAF-independent architecture are reported in Supplementary Figure 15. The median value of each bias is displayed as a band inside each box. Boxes denote values in the second and third quartiles. The length of each whisker is 1.5 times the interquartile range (defined as the height of each box). All values lying outside the whiskers are considered to be outliers. Red line indicates no bias. Numerical results are reported in Supplementary Table 23.

References

    1. Yang J et al. Common SNPs explain a large proportion of the heritability for human height. Nat. Genet 42, 565–569 (2010). - PMC - PubMed
    1. Yang J, Lee SH, Goddard ME & Visscher PM GCTA: a tool for genomewide complex trait analysis. Am. J. Hum. Genet 88, 76–82 (2011). - PMC - PubMed
    1. Yang J et al. Genome partitioning of genetic variation for complex traits using common SNPs. Nat. Genet 43, 519–525 (2011). - PMC - PubMed
    1. Shi H, Kichaev G & Pasaniuc B Contrasting the Genetic Architecture of 30 Complex Traits from Summary Association Data. Am. J. Hum. Genet 99, 139–153 (2016). - PMC - PubMed
    1. Lee SH et al. Estimating the proportion of variation in susceptibility to schizophrenia captured by common SNPs. Nat. Genet 44, 247–250 (2012). - PMC - PubMed

Publication types