. 2017 Oct;591(20):3319-3332.
doi: 10.1002/1873-3468.12843. Epub 2017 Oct 11.

Metabolically active CD4+ T cells expressing Glut1 and OX40 preferentially harbor HIV during in vitro infection

Affiliations

Metabolically active CD4+ T cells expressing Glut1 and OX40 preferentially harbor HIV during in vitro infection

Clovis S Palmer et al. FEBS Lett. 2017 Oct.

Abstract

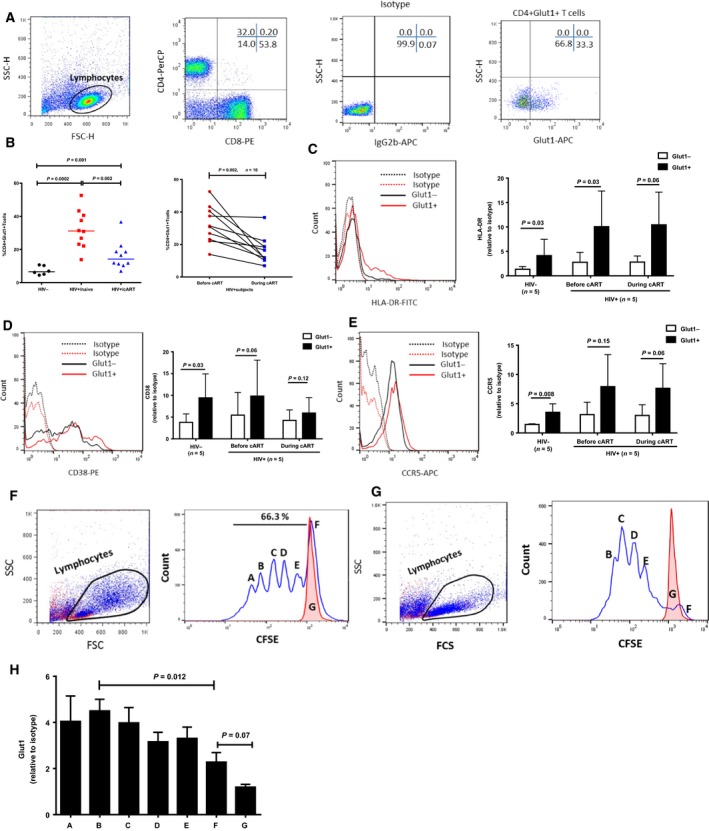
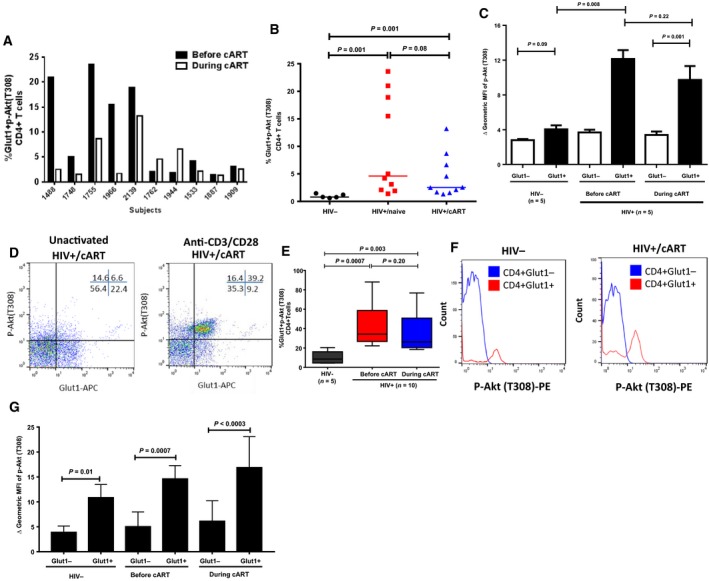
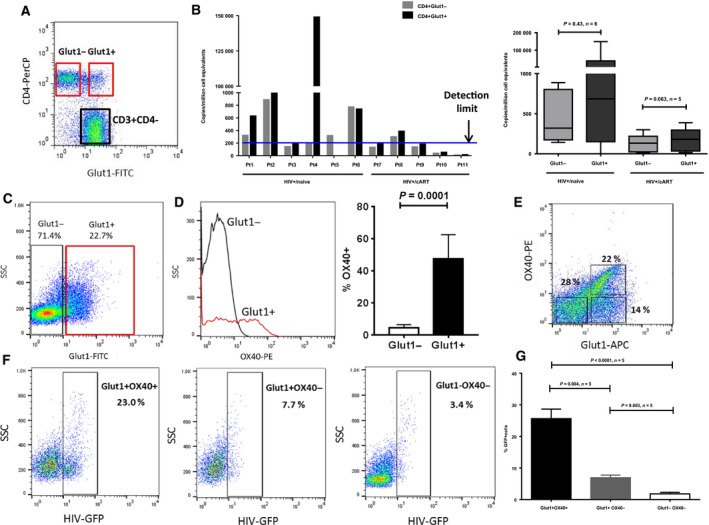
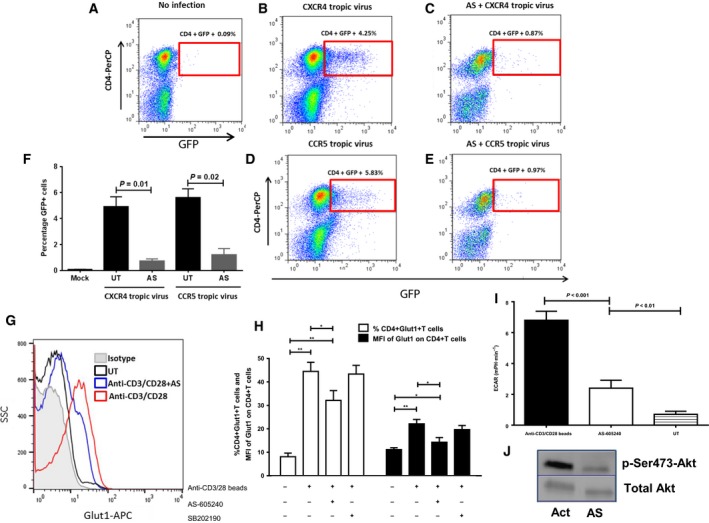
High glucose transporter 1 (Glut1) surface expression is associated with increased glycolytic activity in activated CD4+ T cells. Phosphatidylinositide 3-kinases (PI3K) activation measured by p-Akt and OX40 is elevated in CD4+Glut1+ T cells from HIV+ subjects. TCR engagement of CD4+Glut1+ T cells from HIV+ subjects demonstrates hyperresponsive PI3K-mammalian target of rapamycin signaling. High basal Glut1 and OX40 on CD4+ T cells from combination antiretroviral therapy (cART)-treated HIV+ patients represent a sufficiently metabolically active state permissive for HIV infection in vitro without external stimuli. The majority of CD4+OX40+ T cells express Glut1, thus OX40 rather than Glut1 itself may facilitate HIV infection. Furthermore, infection of CD4+ T cells is limited by p110γ PI3K inhibition. Modulating glucose metabolism may limit cellular activation and prevent residual HIV replication in 'virologically suppressed' cART-treated HIV+ persons.

Keywords: HIV; mTOR; CD4 T cells; Glut1; PI3K; cancer; immunometabolism.


Figures

Figure 1
Figure 1
Glut1 cell surface expression on CD4+ T cells is associated with markers of proliferation and activation. (A) Representative flow cytometric dot plots of PBMCs from an HIV+/cART subject. Lymphocytes (circled) were defined using side scatter (SSC) and forward scatter (FSC) characteristics. The gating strategy shows T cells defined based on CD4 and CD8 surface expression. A representative Glut1‐isotype, and Glut1 antibody staining on CD4+ T cells in peripheral blood from HIV+/cART subjects. (B) Percentage of CD4+Glut1+ T cells in peripheral blood from HIV‐negative, HIV+/naive, and HIV+/cART subjects (left panel). Same subjects as in left panel showing percentages of CD4+Glut1+ T cells before and during cART (right panel). (C) Representative histogram (left panel) and aggregate plot (right panel) of HLA‐DR expression on CD4+Glut1+ and CD4+Glut1− T cell from HIV+ subjects. (D) Representative histogram (left panel) and aggregate plot (right panel) of CD38 expression on CD4+Glut1+ and CD4+Glut1− T cell from HIV+ subjects. (E) Representative histogram (left panel) and aggregate plot (right panel) of CCR5 expression on CD4+Glut1+ and CD4+Glut1− T cell from HIV+ subjects. 5 HIV− and 5 HIV+ subjects were analyzed for all surface markers. (F, G) Representative dot plots showing forward and side scatter properties of PBMCs from two HIV‐negative subject stimulated with 10 μg·mL−1 PHA plus 5 ng·mL−1 IL‐2 for 4 days (blue dots), or cultured without stimulation for the same amount of time (red dots) (left panel). (Right panels) Cells were labeled with CFSE on day 1 as described in Methods, and representative plots of CFSE‐labeled CD4+ T cells after 4 days of incubation with PHA plus IL‐2 (blue line) or unstimulated (red line). (H) The bar chart indicates the cumulative MFI of Glut1 relative to isotype control on CD4+ T cells within each corresponding peak (A–G) showing different rounds of CD4+ T cell replication, and peak G (red) showing CD4+ T cells from unstimulated PBMCs. Cumulative results are obtained from 4 to 5 peaks depending on the amount of cell division. The paired t‐test was used to measure significant differences within groups.
Figure 2
Figure 2
Glut1 cell surface expression on CD4+ T cells is associated with high PI3K activity. (A) Individual comparisons of changes in the percentage of CD4+Glut1+p‐Akt (T308)+ T cells in peripheral blood of HIV+ subjects before and during cART. (B) Aggregate percentage of CD4+Glut1+p‐Akt (T308)+ T cells in peripheral blood from HIV−, and HIV+ subjects before and during cART. (C) Geometric MFI of p‐Akt (T308) in Glut1− and Glut1+CD4+ T cells in PBMCs from HIV−, and HIV+ subjects before and during cART. (D) Representative dot plots showing percentage of CD4+Glut1+p‐Akt (T308)+ T cells within the CD4+ T cell populations of PBMCs from HIV+ subjects stimulated with anti‐CD3/28 microbeads, and (E) showing cumulative data. (F) Representative histogram showing the shift in fluorescence intensity of p‐Akt (T308)‐PE in CD4+ T cell compartments in PBMCs from HIV‐negative and HIV+/cART subjects stimulated with anti‐CD3/28 microbeads, with cumulative data represented in (G). The error bars represent mean (SEM). The paired t‐test and the Mann–Whitney t‐tests were used to measure significant differences within and between the groups, respectively.
Figure 3
Figure 3
CD4+Glut1+ cells take up more HIV in culture than do CD4+Glut1− T cells. (A) Representative flow cytometric dot plot showing the cell surface expression of Glut1 on CD4+ T cells after being gated within the lymphocyte and CD3+ T cell population of PBMCs from HIV+/naive or HIV+/cART subjects. The red square represents the gating strategy used to sort Glut1− from Glut1+ cells within the CD4+ population in order to analyze total cellular HIV DNA. (B, Left panel) Total HIV DNA in CD4+Glut1+ and CD4+Glut1− T cell populations in HIV+/naive (n = 6) and HIV+/cART (n = 5) subjects. The blue line represents the detection limit of the assay. (B, Right panel) Combined data for total HIV DNA levels in CD4+Glut1+ and CD4+Glut1− T cells from HIV+/naive or HIV+/cART subjects. (C) Representative dot plot of cells gated on CD3+CD4+ T cells from PBMCs of HIV+/cART subjects cultured for 3 days in the absence of GFP‐tagged HIV (n = 5). (D) Representative histogram of OX40 on CD4+Glut1− and CD4+Glut1− cells from subjects in C (left panel), with cumulative data shown (right panel). (E) Representative dot plot showing OX40 and Glut1 expression on cells gated on CD4+ T cells from PBMCs of HIV+/cART subjects cultured for 3 days with GFP‐labeled HIV. (F) Representative dot plots showing the percentages of GFP+ cells in CD4+Glut1+OX40+, CD4+Glut1+OX40−, and CD4+Glut1−OX40− T cells. (G) Graph showing cumulative frequency of GFP+ cells within different populations of CD4+ T cells based on their cell surface expression of Glut1 and OX40 (n = 5). The Wilcoxon matched‐pairs signed‐rank t‐test was used to evaluate significant differences between the levels of HIV DNA in CD4+Glut1+ and CD4+Glut1− T cells in HIV+/cART subjects. The Mann–Whitney t‐tests were used to measure significant differences in the percentage of GFP+ cells within the CD4+ T cell populations.
Figure 4
Figure 4
Inhibition of PI3Kγ in CD4+ T cells suppresses glycolysis and HIV infection. Purified PBMCs for HIV− subjects were pretreated for 48 h with 200 nm AS‐605240 (AS) and activated with 10 μg·mL−1 PHA plus 5 ng·mL−1 IL‐2 for 24 h prior to infection with either a CXCR4 or a CCR5 tropic virus. (A) PBMCs were activated but were not incubated with HIV. (B) PBMCs with no inhibitor prior to activation, incubated with CXCR4 tropic HIV. (C) PBMCs pretreated with AS‐605240 (AS) prior to activation and incubated with CXCR4 tropic HIV. (D) PBMCs with no inhibitor prior to activation, incubated with CCR5 tropic virus. (E) PBMCs pretreated with AS‐605240 (AS) prior to activation and incubated with CCR5 tropic virus. (F) Combined data from three independent experiments showing the effects of PI3K subunit p110γ isoform inhibition on HIV infection. The Wilcoxon matched‐pairs signed‐rank t‐test was used to evaluate significant differences between treatments. (G, H) Negatively selected and purified CD4+ T cells from HIV− controls were left untreated or treated with AS for 24 h followed by activation with anti‐CD3/CD28 beads (bead: cell ratio, 1 : 2), and Glut1 cell surface expression measured. Representative histogram is indicated in panel G and shows the effect of AS on Glut1 expression. Activated cells were stained with isotype control. Cumulative data are shown in panel H. The p38 MAP kinase inhibitor SB202190 (10 μm) was used as a nonmetabolic inhibitor control. (I) ECAR of purified CD4+ T cells. Cells were either left unactivated (UT), or inhibited and activated as in G above. Bars graphs represent mean ± SD. Differences between individual groups were analyzed using the nonparametric two‐tailed Mann–Whitney U test. Statistical differences are indicated by P values above the plots. (J) Western blot analysis showing the effect of AS‐605240 pretreatment on PI3K activity (p‐Ser473Akt) in anti‐CD3/CD28‐activated (Act) CD4+ T cells. Total Akt was used as a reference control.

References

    1. Sorbara LR, Maldarelli F, Chamoun G, Schilling B, Chokekijcahi S, Staudt L, Mitsuya H, Simpson IA and Zeichner SL (1996) Human immunodeficiency virus type 1 infection of H9 cells induces increased glucose transporter expression. J Virol 70, 7275–7279. - PMC - PubMed
    1. Hollenbaugh JA, Munger J and Kim B (2011) Metabolite profiles of human immunodeficiency virus infected CD4+ T cells and macrophages using LC–MS/MS analysis. Virology 415, 153–159. - PMC - PubMed
    1. Chambers JW, Maguire TG and Alwine JC (2010) Glutamine metabolism is essential for human cytomegalovirus infection. J Virol 84, 1867–1873. - PMC - PubMed
    1. Yu Y, Clippinger AJ and Alwine JC (2011) Viral effects on metabolism: changes in glucose and glutamine utilization during human cytomegalovirus infection. Trends Microbiol 19, 360–367. - PMC - PubMed
    1. Jacobs SR, Herman CE, Maciver NJ, Wofford JA, Wieman HL, Hammen JJ and Rathmell JC (2008) Glucose uptake is limiting in T cell activation and requires CD28‐mediated Akt‐dependent and independent pathways. J Immunol 180, 4476–4486. - PMC - PubMed

MeSH terms