. 2017 Sep 11:78:11.20.1-11.20.24.
doi: 10.1002/cpph.25.

All-Optical Electrophysiology for Disease Modeling and Pharmacological Characterization of Neurons

Affiliations

All-Optical Electrophysiology for Disease Modeling and Pharmacological Characterization of Neurons

Christopher A Werley et al. Curr Protoc Pharmacol. .

Abstract

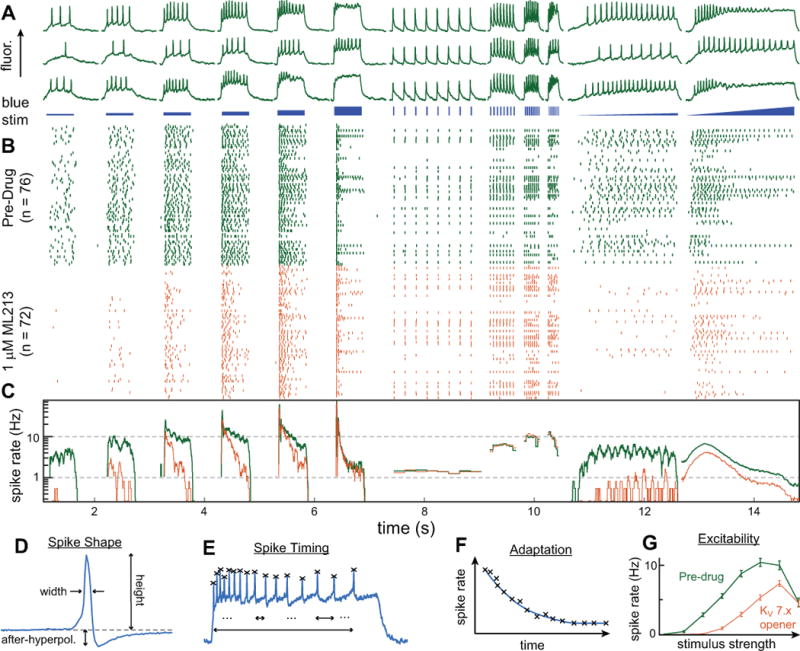
A key challenge for establishing a phenotypic screen for neuronal excitability is measurement of membrane potential changes with high throughput and accuracy. Most approaches for probing excitability rely on low-throughput, invasive methods or lack cell-specific information. These limitations stimulated the development of novel strategies for characterizing the electrical properties of cultured neurons. Among these was the development of optogenetic technologies (Optopatch) that allow for stimulation and recording of membrane voltage signals from cultured neurons with single-cell sensitivity and millisecond temporal resolution. Neuronal activity is elicited using blue light activation of the channelrhodopsin variant 'CheRiff'. Action potentials and synaptic signals are measured with 'QuasAr', a rapid and sensitive voltage-indicating protein with near-infrared fluorescence that scales proportionately with transmembrane potential. This integrated technology of optical stimulation and recording of electrical signals enables investigation of neuronal electrical function with unprecedented scale and precision. © 2017 by John Wiley & Sons, Inc.

Keywords: CheRiff; Optical electrophysiology; Optopatch; QuasAr; disease modeling; induced pluripotent stem cell; optogenetics; voltage indicator.


Conflict of interest statement

Conflicts of Interest: Authors on this paper work for Q-State Biosciences, a startup biotechnology company using the Optopatch technology and stem-cell disease models in drug discovery.

Figures

Figure 1
Figure 1. Rat hippocampal cultures
(A) A phase contrast image of rat hippocampal neurons 7 days after plating (DIV7) prior to lentiviral transduction. Cells were seeded at a density of 20k cells/cm2 on cyclic-olefin copylmer Ibidi 8 well dishes, and show early neurite growth. (B) A phase contrast image at DIV13, after transduction and addition of glial cells. (C) A fluorescence image of QuasAr3-Citrine expression in the same cells at DIV13. Gamma has been set to 0.65 to simultaneously see the bright cell bodies as well as dimmer neurites.
Figure 2
Figure 2. Microscope optical diagrams
(A) The basic microscope design including required elements for Optopatch imaging. Key components include a high numerical aperture 60× oil immersion objective used to couple light into the sample at grazing incidence, a scientific CMOS camera, two lasers that can be rapidly modulated with analog control signals, and a data acquisition (DAQ) device to generate the control signals. The microscope is built using a commercial, inverted microscope body. The red and blue lasers are combined with a dichroic, and the co-propagate to the sample (indicated by a purple color). (B) A more advanced design for higher throughput and patterned illumination. To fit the highest possible number of cells onto the camera ROI that can be recorded at 1 kHz, de-magnify the image to 15×. The blue laser is routed through an acousto-optic tunable filter (AOTF), which enables rapid intensity modulation for fast stimulus paradigms (see Fig. 3) without the power fluctuations that result from the inevitable temperature instabilities that arise in the laser cavity during direct modulation of the laser drive current. The blue light is then reflected off a digital micromirror device (DMD) to enable patterned illumination for stimulating individual cells or cellular sub-compartments.
Figure 3
Figure 3. Human iPS neurons spiking patterns under various stimulus protocols
Neurons are stimulated with spike trains, left to fire spontaneously, stimulated with steps of different intensities, and stimulated with ramped intensity. The inset on the right shows a magnified view of a volley of action potentials during ramp stimulation.
Figure 4
Figure 4. Image segmentation in CDI iCell neurons
At high magnification, neurons can be identified manually, but at lower magnification or in high-density cultures, automated analysis is required. Principal component analysis (PCA) identifies significant sources of variation in the movie, representative of neuronal firing, but time traces and pixel weight maps are typically mixtures of multiple neurons. Independent component analysis (ICA) “unmixes” the signal, identifying individual time traces even in crowded images where cells are partially overlapped. This figure shows results from one such field of view, where 5 overlapped neurons are present. (A) Identified neuronal sources and (B) their action potential trains resulting from PCA/ICA analysis. Red indicates negative pixel weights. (C) The composite image with all sources combined.
Figure 5
Figure 5. Analysis workflow
An overview of the cascade of analyses used to extract data from the segmented images. Here the data from 76 cells are pooled. (A) Time traces from three exemplary neurons in response to the blue stimulus pattern shown just underneath. The stimulus includes 500 ms blue steps of different intensities, pulse trains to probe maximal firing rates, and ramps where the stimulus strength is smoothly increased. (B) A raster plot showing the aggregated firing pattern of all the cells. Each row in the raster is one cell, and each tick in the row represents one action potential. Green represents the spikes before compound addition and orange represents spikes from the same cells after the addition of ML213, a KV 7.x potassium channel agonist that hyperpolarizes the cell and reduces firing. (C) The spike rate, calculated by averaging over all the spikes in (B), reveals clear drug-induced reduction in firing during the steps and ramps. In addition to examining overall firing rate, we extract many parameters related to spike shape and timing from each cell. (D). A magnified view of a single spike showing typical extracted spike shape parameters including width, height, and after-hyperpolarization. (E) Extracted spike timing properties, including adaptation (F), which is the gradual slowing of spike rate after the onset of stimulus displayed by many neurons. (G) Aggregated data showing a highly significant reduction in spike rate for each stimulus step in the staircase.

References

    1. Ans B, Hérault J, Jutten C. Architectures neuromim{é}tiques adaptatives: D{é}tection de primitives. Proceedings of “Cognitiva. 1985;85:593–597.
    1. Bales KL, Solomon M, Jacob S, Crawley JN, Silverman JL, Larke RH, Sahagun E, Puhger KR, Pride MC, Mendoza SP. Long-term exposure to intranasal oxytocin in a mouse autism model. Translational psychiatry. 2014;4:e480. Available at: http://www.pubmedcentral.nih.gov/articlerender.fcgi?artid=4259989&tool=p.... - PMC - PubMed
    1. Bell AJ, Sejnowski TJ. The “independent components” of natural scenes are edge filters. Vision research. 1997;37:3327–3338. - PMC - PubMed
    1. Di Giorgio FP, Boulting GL, Bobrowicz S, Eggan KC. Human embryonic stem cell-derived motor neurons are sensitive to the toxic effect of glial cells carrying an ALS-causing mutation. Cell stem cell. 2008;3:637–48. Available at: http://www.ncbi.nlm.nih.gov/pubmed/19041780 [Accessed August 25, 2014] - PubMed
    1. DeMattos RB, Bales KR, Cummins DJ, Dodart JC, Paul SM, Holtzman DM. Peripheral anti-A beta antibody alters CNS and plasma A beta clearance and decreases brain A beta burden in a mouse model of Alzheimer’s disease. Proceedings of the National Academy of Sciences of the United States of America. 2001;98:8850–5. Available at: /pmc/articles/PMC37524/?report=abstract. - PMC - PubMed