Linearity, Bias, and Precision of Hepatic Proton Density Fat Fraction Measurements by Using MR Imaging: A Meta-Analysis
- PMID: 28892458
- PMCID: PMC5813433
- DOI: 10.1148/radiol.2017170550
Linearity, Bias, and Precision of Hepatic Proton Density Fat Fraction Measurements by Using MR Imaging: A Meta-Analysis
Abstract
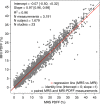
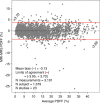
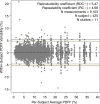
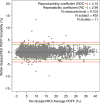
Purpose To determine the linearity, bias, and precision of hepatic proton density fat fraction (PDFF) measurements by using magnetic resonance (MR) imaging across different field strengths, imager manufacturers, and reconstruction methods. Materials and Methods This meta-analysis was performed in accordance with Preferred Reporting Items for Systematic Reviews and Meta-Analyses guidelines. A systematic literature search identified studies that evaluated the linearity and/or bias of hepatic PDFF measurements by using MR imaging (hereafter, MR imaging-PDFF) against PDFF measurements by using colocalized MR spectroscopy (hereafter, MR spectroscopy-PDFF) or the precision of MR imaging-PDFF. The quality of each study was evaluated by using the Quality Assessment of Studies of Diagnostic Accuracy 2 tool. De-identified original data sets from the selected studies were pooled. Linearity was evaluated by using linear regression between MR imaging-PDFF and MR spectroscopy-PDFF measurements. Bias, defined as the mean difference between MR imaging-PDFF and MR spectroscopy-PDFF measurements, was evaluated by using Bland-Altman analysis. Precision, defined as the agreement between repeated MR imaging-PDFF measurements, was evaluated by using a linear mixed-effects model, with field strength, imager manufacturer, reconstruction method, and region of interest as random effects. Results Twenty-three studies (1679 participants) were selected for linearity and bias analyses and 11 studies (425 participants) were selected for precision analyses. MR imaging-PDFF was linear with MR spectroscopy-PDFF (R2 = 0.96). Regression slope (0.97; P < .001) and mean Bland-Altman bias (-0.13%; 95% limits of agreement: -3.95%, 3.40%) indicated minimal underestimation by using MR imaging-PDFF. MR imaging-PDFF was precise at the region-of-interest level, with repeatability and reproducibility coefficients of 2.99% and 4.12%, respectively. Field strength, imager manufacturer, and reconstruction method each had minimal effects on reproducibility. Conclusion MR imaging-PDFF has excellent linearity, bias, and precision across different field strengths, imager manufacturers, and reconstruction methods. © RSNA, 2017 Online supplemental material is available for this article. An earlier incorrect version of this article appeared online. This article was corrected on October 2, 2017.
Figures


Comment in
-
Quantitative Imaging: The Translation from Research Tool to Clinical Practice.Radiology. 2018 Feb;286(2):499-501. doi: 10.1148/radiol.2017172258. Radiology. 2018. PMID: 29356630 No abstract available.
References
-
- Loomba R, Sanyal AJ. The global NAFLD epidemic. Nat Rev Gastroenterol Hepatol 2013;10(11):686–690. - PubMed
-
- Wong RJ, Cheung R, Ahmed A. Nonalcoholic steatohepatitis is the most rapidly growing indication for liver transplantation in patients with hepatocellular carcinoma in the U.S. Hepatology 2014;59(6):2188–2195. - PubMed
-
- Matteoni CA, Younossi ZM, Gramlich T, Boparai N, Liu YC, McCullough AJ. Nonalcoholic fatty liver disease: a spectrum of clinical and pathological severity. Gastroenterology 1999;116(6):1413–1419. - PubMed
-
- Ekstedt M, Franzén LE, Mathiesen UL, et al. . Long-term follow-up of patients with NAFLD and elevated liver enzymes. Hepatology 2006;44(4):865–873. - PubMed
-
- Rubinstein E, Lavine JE, Schwimmer JB. Hepatic, cardiovascular, and endocrine outcomes of the histological subphenotypes of nonalcoholic fatty liver disease. Semin Liver Dis 2008;28(4):380–385. - PubMed
Publication types
MeSH terms
Substances
Grants and funding
LinkOut - more resources
Full Text Sources
Other Literature Sources
Medical

