. 2017 Nov;18(11):1249-1260.
doi: 10.1038/ni.3837. Epub 2017 Sep 11.

Dynamic regulation of T follicular regulatory cell responses by interleukin 2 during influenza infection

Affiliations

Dynamic regulation of T follicular regulatory cell responses by interleukin 2 during influenza infection

Davide Botta et al. Nat Immunol. 2017 Nov.

Abstract

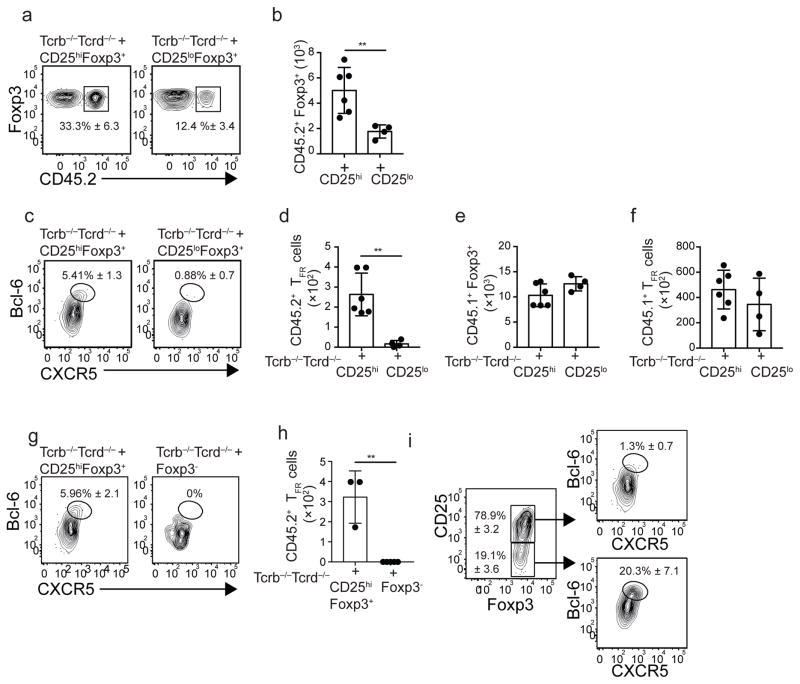
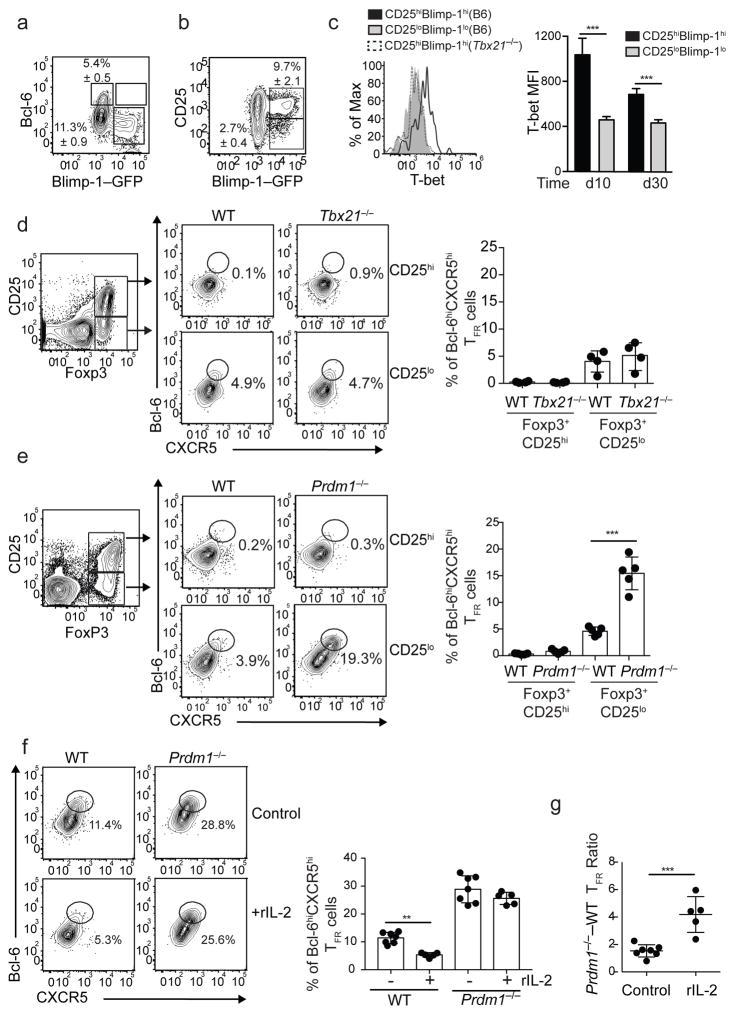
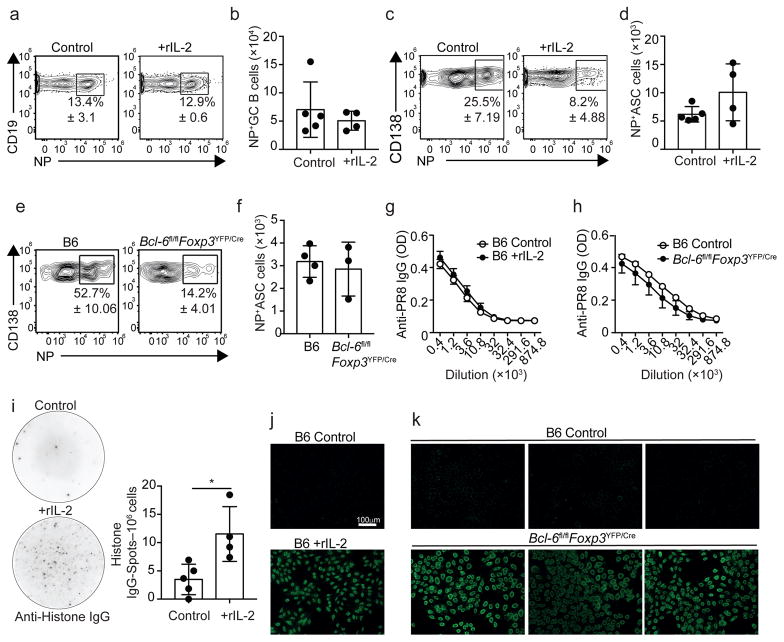
Interleukin 2 (IL-2) promotes Foxp3+ regulatory T (Treg) cell responses, but inhibits T follicular helper (TFH) cell development. However, it is not clear how IL-2 affects T follicular regulatory (TFR) cells, a cell type with properties of both Treg and TFH cells. Using an influenza infection model, we found that high IL-2 concentrations at the peak of the infection prevented TFR cell development by a Blimp-1-dependent mechanism. However, once the immune response resolved, some Treg cells downregulated CD25, upregulated Bcl-6 and differentiated into TFR cells, which then migrated into the B cell follicles to prevent the expansion of self-reactive B cell clones. Thus, unlike its effects on conventional Treg cells, IL-2 inhibits TFR cell responses.


Figures

Figure 1
Figure 1. Kinetic of the TFR cell response to influenza
(A–C) B6 mice were infected with PR8 and cells from the mLN were analyzed on day 30 after infection by flow cytometry. (A) Expression of Bcl-6 and CXCR5 in FoxP3+CD69hi and FoxP3+CD69lo CD4+ T cells. Expression of PD-1 (B) and GL-7 (C) on Bcl-6loCXCR5lo and Bcl-6hiCXCR5hi FoxP3+CD69hi CD4+ T cells. Data are representative of five independent experiments (3–5 mice per experiment). (D–E) B6 and B6.Sh2d1a−/− mice were infected with PR8 and the frequency (D) and number (E) of FoxP3+CD69hiCD4+ T cells with a Bcl-6hiCXCR5hi TFR cell phenotype were evaluated in the mLN on day 30 after infection. Data are representative of three independent experiments (mean ± SD of 3–5 mice per group). *P < 0.05, **P < 0.01, ***P < 0.001. P values were determined using a two-tailed Student’s t-test. (F–I) B6 mice were infected with PR8 and cells from the mLN were analyzed by flow cytometry at the indicated time-points. Frequency (F) and number (G) of Bcl-6hiCXCR5hi TFR cells. Representative plots were gated on FoxP3+CD69hiCD19 CD4+ T cells. (H) Number of FoxP3+CD69hi Treg cells with a Bcl-6loCXCR5lo phenotype. Frequency (I) and number (J) of CD19+CD138–PNAhiCD95hi GC B cells. Frequency (K) and number (L) of Bcl-6hiCXCR5hi TFH cells. Representative plots were gated on CD4+FoxP3CD19T cells. Data are shown as the mean ± SD (n=4–5 mice/time point). Data are representative of three independent experiments. *P < 0.05, **P < 0.01, ***P < 0.001. P values were determined using a two-tailed Student’s t-test.
Figure 2
Figure 2. TFR cells are CD25lo
(A–E) B6 mice were infected with PR8 and cells from the mLN were analyzed on day 30 by flow cytometry. (A) Frequency of CD25hi and CD25lo FoxP3+CD69hi CD4+ T cells with a Bcl-6hiCXCR5hi phenotype. Expression of PD-1 (B) and GL-7 (C) in CD25hi and CD25lo Bcl-6hiCXCR5hi cells. Data are representative of five independent experiments. Data are shown as the mean ± SD (n=4 mice). P values were determined using a two-tailed Student’s t-test. (D) B6 mice were infected with PR8 and STAT5 phosphorylation in CD4+B220CD25loBcl-6hiCXCR5hi Foxp3+ TFR cells, CD4+B220CD25hiBcl-6loCXCR5loFoxp3+ conventional Treg cells and CD4+B220Bcl-6hiCXCR5hi Foxp3 TFH cells was determined by flow cytometry on day 15. Cells were stimulated with 100ng/ml of rIL-2 for 15 minutes before analyzing staining. Data are representative of two independent experiments. Data are shown as the mean ± SD (n=4 mice). *P < 0.05, **P < 0.01, ***P < 0.001. P values were determined using a two-tailed Student’s t-test. (E–F) Conventional Treg cells (CD19CD4+FoxP3+CD69hiPD-1loCXCR5loCD25hi) and TFR cells (CD19CD4+FoxP3+CD69hiPD-1hiCXCR5hiCD25lo) were sorted from the mLN of FoxP3–DTR–GFP at day 30 after infection and RNA-seq was performed. (E) Gene set enrichment analysis (GSEA, Broad Institute) examining differentially expressed genes between Treg cells and TFR cells (adjusted p-value <0.05, Log2fold change greater than or equal to 1. The Normalized Enriched Score (NES) and the number of up-regulated genes for each of the top 10 Hallmark -signaling Pathways resulting from the GSEA analysis are shown. (F) Heatmap displaying the expression of the IL-2–STAT5 Hallmark-signaling pathway genes that are differentially expressed in conventional Treg cells relative to TFR cells. Three replicates for each cell type were obtained from three independent experiments. (G and H) Expression of CD25 (G) and CD122 (H) in Bcl-6loCXCR5lo FoxP3+CD69hi CD4+ T cells, Bcl-6hiCXCR5hi TFR cells and CD44loCD69loFoxP3 CD4+ T cells (naïve). Data are representative of two independent experiments. Data are shown as the mean ± SD (n=5 mice). *P < 0.05, **P < 0.01, ***P < 0.001. P values were determined using a two-tailed Student’s t-test.
Figure 3
Figure 3. CD25+FoxP3+ Treg cells down-regulate CD25 and differentiate into TFR cells
(A–F) Equivalent numbers of sorted CD25hiFoxP3+ and CD25loFoxP3+ CD4+ T cells obtained from the spleens of naïve CD45.2+ B6-Foxp3-DTR–GFP mice were adoptively transferred into Tcrb−/−Tcrd−/− recipient mice. Recipient mice also received purified CD4+ and CD8+ T cells from the spleen of naïve CD45.1+ B6 mice. One day later, recipient mice were infected with influenza and donor-derived CD45.2+ (A–D) and donor-derived CD45.1+ (E–F) CD69+FoxP3+CD4+ T cells were assessed in the mLN on day 30 by flow cytometry. The frequency (A) and number (B) of CD45.2+FoxP3+ cells in recipients receiving CD25hiFoxP3+ and CD25loFoxP3+ cells are shown. Plots were gated on FoxP3+CD69hiCD4+ T cells. The frequency (C) and number (D) of CD45.2+CD69+FoxP3+ CD4+ T cells with a Bcl-6hiCXCR5hi phenotype in recipients receiving CD25hiFoxP3+ and CD25loFoxP3+ cells are shown. (E) The number of donor-derived CD45.1+CD69+FoxP3+CD4+ T cells in recipients receiving CD25hiFoxP3+ and CD25loFoxP3+ cells are shown. (F) The number of donor-derived CD45.1+CD69+FoxP3+ T cells with a Bcl-6hiCXCR5hi phenotype in recipients receiving CD25hiFoxP3+ and CD25loFoxP3+ cells are shown. Data were pooled from two independent experiments (mean ± SD). *P < 0.05, **P < 0.01, ***P < 0.001. P values were determined using a two-tailed Student’s t-test. (G–H) Equivalent numbers of sorted CD25hiFoxP3+ and FoxP3 CD4+ T cells obtained from the spleen of naïve CD45.2+ B6-Foxp3-DTR–GFP mice were adoptively transferred into Tcrb−/−Tcrd−/− recipient mice. The recipient mice also received purified CD4+ and CD8+ T cells from the spleen of naïve CD45.1+ B6 mice. One day later, the mice were infected with influenza and the donor-derived CD45.2+ CD69+FoxP3+CD4+ T cells were assessed in the mLN on day 30 by flow cytometry. Frequency (G) and number (H) of CD45.2+CD69+FoxP3+ T cells with a Bcl-6hiCXCR5hi phenotype in recipients of CD25hiFoxP3+ and FoxP3CD4+ T cells. (I) Frequencies of Bcl-6hiCXCR5hi in CD25hi and CD25lo FoxP3+ cells derived from the CD45.2+CD25hiFoxp3+ donors. Data are representative of two independent experiments. Data are shown as the mean ± SD (n=3–5 mice). *P < 0.05, **P < 0.01, ***P < 0.001. P values were determined using a two-tailed Student’s t-test.
Figure 4
Figure 4. IL-2 inhibits TFR cell differentiation
(A–B) B6 mice were infected with PR8 and treated daily with 30,000 U of rIL-2 or PBS starting on day 20. Cells from the mLNs were analyzed by flow cytometry on day 30. As a control, cells from the mLNs of day 10 infected mice are also shown. The frequency (A) and number (B) of CD25loFoxP3+ CD4+ T cells with a Bcl-6hiCXCR5hi phenotype. Data are representative of three independent experiments. Data are shown as the mean ± SD (n=3–5 mice per group). *P < 0.05, **P < 0.01, ***P < 0.001. P values were determined using a two-tailed Student’s t-test. (C) Il21-mCherry-Il2-emGFP mice were infected with PR8 and cells from the mLN were analyzed at the indicated time-points. Representative plots were gated on CD4+ T cells. Data are shown as the mean ± SD (n=3–5 mice per group). Data are representative of three independent experiments. (D–H) B6 mice were infected with PR8 and treated daily with 500 μg of a mix of anti IL-2 neutralizing Abs (JES6-1A12 + S4B6-1) or control Ab (2A3) starting on day 3 after infection. The frequency (D) and number (E) of Bcl-6hiCXCR5hi TFR cells were calculated on day 10 after infection. Plots were gated on FoxP3+CD69hiCD4+ T cells. (F) Number of Bcl-6hiCXCR5hi TFH cells. Frequency (G) and number (H) of CD25hiFoxP3+ cells. Plots were gated on CD4+ T cells. Data are representative of three independent experiments. Data are shown as the mean ± SD (n=4–5 mice per group). *P < 0.05, **P < 0.01, ***P < 0.001. P values were determined using a two-tailed Student’s t-test. (I–O) B6.FoxP3-DTR–GFP mice were infected with PR8 and CD25hiFoxP3+ CD4+ T cells were sorted from the mLN and spleens at day 7 after infection. Sorted cells were then activated with anti-CD3–CD28 beads in the presence of high (200U/ml) or low (5U/ml) IL-2 concentrations. The expression of CD25 (I), Blimp-1 (J), T-bet (K), Bcl-6 (L) and CXCR5 (M) were assessed 72h later by flow cytometry. The frequency (N) and number (O) of FoxP3+ CD4+ T cells with a Bcl-6hiCXCR5hi phenotype are shown. Data are representative of three independent experiments. All values were obtained in triplicate and the data are shown as the mean ± SD. *P < 0.05, **P < 0.01, ***P < 0.001P. values were determined using a two-tailed Student’s t-test.
Figure 5
Figure 5. IL-2 inhibits TFR cell differentiation by a Blimp-1 mechanism
(A–B) B6.Blimp-1/YFP reporter mice were infected with PR8 and cells from the mLN were analyzed on day 30 by flow cytometry. (A) Expression of Bcl-6 and Blimp-1/YFP in FoxP3+CD69hiCD4+ T cells. (B) Expression of CD25 and Blimp-1/YFP in FoxP3+CD69hiCD4+ T cells. Data are representative of three independent experiments (mean ± S.D of 3–5 mice per group). (C) B6 and Tbx21−/−mice were infected with PR8 and the expression of T-bet in CD25hiBlimphi and CD25loBlimplo FoxP3+CD69hiCD4+ T cells was analyzed at days 10 and 30 by intracellular staining. Data are representative of two independent experiments (mean ± S.D of 3–5 mice per group). *P < 0.05, **P < 0.01, ***P < 0.001. P values were determined using a two-tailed Student’s t-test. (D) Tcrb−/−Tcrd−/− mice were irradiated and reconstituted with a 50:50 mix of BM from CD45.1+ WT and CD45.2+ Tbx21−/− donors. Eight weeks later, reconstituted mice were infected with PR8 and cells from the mLN were analyzed on day 10. The frequency of CD25loFoxP3+ and CD25hiFoxP3+ cells with a Bcl-6hiCXCR5hi phenotype was determined in the CD45.1+ and CD45.2+ compartments. Representative plots are shown. Data in the graph are shown as the mean ± SD (n=4 mice). Data are representative of two independent experiments. (E) Tcrb−/−Tcrd−/− mice were irradiated and reconstituted with a 50:50 mix of BM from CD45.1+ WT and CD45.2+ Prdm1fl/fx-Lckcre/+ donors. Eight weeks later, reconstituted mice were infected with PR8 and cells from the mLN were analyzed on day 10. The frequency of CD25loFoxP3+ and CD25hiFoxP3+ cells with a Bcl-6hiCXCR5hi phenotype were calculated in the CD45.1+ and CD45.2+ compartments. Representative plots are shown. Data in the graph are shown as the mean ± SD (n=5 mice). Data are representative of three independent experiments. *P < 0.05, **P < 0.01, ***P < 0.001. P values were determined using a two-tailed Student’s t-test. (F–G) WT-Prdm1fl/fl-Lckcre/+ chimeric mice were infected with PR8 and treated daily with 30,000 U of rIL-2 or PBS (control) starting 20 days after infection. Cells from the mLNs were analyzed by flow cytometry on day 30. (F) Frequency of CD45.1+ and CD45.2+ CD25loFoxP3+ CD4+ T cells with a Bcl-6hiCXCR5hi TFR-cell phenotype. Data in the graph are shown as the mean ± SD (n=5–7 mice/group). Representative plots are shown. (G) Ratio of Prdm1−/− to WT TFR cell was calculated in control and rIL-2-treated mice. Data are shown as the mean ± SD (n=5–7 mice/group). Data are representative of two independent experiments. *P < 0.05, **P < 0.01, ***P < 0.001. P values were determined using a two-tailed Student’s t-test.
Figure 6
Figure 6. Abnormal expansion of CD138+ ASCs in the absence of TFR cells
(A–H) B6 and Bcl-6fl/flFoxp3YFP/Cre mice were infected with PR8 and cells from the mLN were analyzed by flow cytometry at day 30. Frequency (A) and number (B) of PD-1hiCXCR5hi TFR cells. Representative plots were gated on FoxP3+CD69hiCD25loCD19 CD4+ T cells. Frequency (C) and number (D) of PD-1hiCXCR5hi TFH cells. Representative plots were gated on FoxP3CD19 CD4+ T cells. Frequency (E) and number (F) of CD19+CD138–GL-7+CD38loCD95hi GC B cells. Frequency (G) and number (H) of CD138+ ASCs. Data are shown as the mean ± SD (n=3–5 mice/group). Data are representative of three independent experiments. *P < 0.05, **P < 0.01, ***P < 0.001. P values were determined using a two-tailed Student’s t-test.
Figure 7
Figure 7. CD138+ ASCs accumulate in TFR cell depleted mice
(A–F) Tcrb−/−Tcrd−/− mice were irradiated and reconstituted with a 50:50 mix of BM from CD45.1+ FoxP3-DTR and CD45.2+ B6 donors (FoxP3-WT) or from CD45.1+ FoxP3-DTR and CD45.2+ Cxcr5−/−donors (FoxP3-Cxcr5−/−). (A) Reconstituted FoxP3-WT and FoxP3-Cxcr5−/−chimeras were infected with PR8 and the frequency of CD45.1+ and CD45.2+ cells within the FoxP3+CD69hiCD25lo TFR cell population was calculated on day 50. (B–F) Reconstituted FoxP3-WT and FoxP3- Cxcr5−/− chimeras were infected with PR8, treated with DT every four days starting 20 days after infection, and cells from the mLN were analyzed on day 50. Frequency (B) and number (C) of Bcl-6hiCXCR5hi TFR cells. Representative plots were gated on FoxP3+CD25loCD19 CD4+ T cells. (D) Number of conventional CD25+ FoxP3+ Treg cells. Frequency (E) and number (F) of CD138+ ASCs. Data are shown as the mean ± SD (n=4–5 mice/group). Data are representative of three independent experiments. *P < 0.05, **P < 0.01, ***P < 0.001. P values were determined using a two-tailed Student’s t-test. (G–H) B6 mice were infected with PR8 and treated daily with 15,000 U of rIL-2 or PBS starting on day 20. Cells from the mLNs were analyzed by flow cytometry on day 30. Frequency (G) and number (H) of CD138+ ASCs. Data are shown as the mean ± SD (n=4–5 mice/group). Data are representative of four independent experiments. *P < 0.05, **P < 0.01, ***P < 0.001. P values were determined using a two-tailed Student’s t-test.
Figure 8
Figure 8. TFR cells prevent the development of self-reactive ASC responses after infection
(A–D) B6 mice were infected with PR8 and treated daily with 15,000 U of rIL-2 or PBS starting on day 20. Cells from the mLN were analyzed by flow cytometry on day 30. Frequency (A) and number (B) of CD19+CD138–GL-7+CD38loCD95hi GC B cells that were NP-specific. Frequency (C) and number (D) of CD138+ ASCs that were influenza-NP specific. Data are shown as the mean ± SD (n=4–5 mice/group). Data are representative of four independent experiments. (E–F) B6 and Bcl-6fl/flFoxp3YFP/Cre mice were infected with PR8 and CD138+ ASCs from the mLN were analyzed by flow cytometry on day 30. Frequency (E) and number (F) of CD138+ ASCs that were NP-specific. Data are shown as the mean ± SD (n=3–4 mice/group). Data are representative of three independent experiments. (G) B6 mice were infected with PR8 and treated daily with 15,000 U of rIL-2 or PBS starting on day 20. Serum was obtained on day 30 and PR8-specific IgG Abs were measured by ELISA. Data are representative of three independent experiments (mean ± SD of 5 mice per group). (H) B6 and Bcl-6fl/flFoxp3YFP/Cre mice were infected with PR8. Serum from was obtained on day 30 and PR8-specific IgG Abs were measured by ELISA. (I) B6 mice were infected with PR8 and treated daily with 15,000 U of rIL-2 or PBS starting 20 days after infection. Histone-specific IgG-secreting cells in the mLN were enumerated by ELISPOT on day 30. Data are representative of two independent experiments (mean ± SD of 4–5 mice per group). *P < 0.05, **P < 0.01, ***P < 0.001. All P values were determined using a two-tailed Student’s t-test. (J) The presence of ANAs in the serum from day 30 influenza-infected control and IL-2-treated mice was determined by fluorescence microscopy using HEp-2 slides. Images are representative of two independent experiments (n=4–5 mice/group). (K) ANAs in the serum from day 30 influenza-infected B6 and Bcl-6fl/flFoxp3YFP/Cre mice. Images are representative of three independent experiments (n=4–5 mice/group).

Comment in

References

    1. Yuan X, Cheng G, Malek TR. The importance of regulatory T-cell heterogeneity in maintaining self-tolerance. Immunological reviews. 2014;259:103–114. - PMC - PubMed
    1. Lio CW, Hsieh CS. A two-step process for thymic regulatory T cell development. Immunity. 2008;28:100–111. - PMC - PubMed
    1. Burchill MA, Yang J, Vogtenhuber C, Blazar BR, Farrar MA. IL-2 receptor beta-dependent STAT5 activation is required for the development of Foxp3+ regulatory T cells. J Immunol. 2007;178:280–290. - PubMed
    1. Yao Z, et al. Nonredundant roles for Stat5a/b in directly regulating Foxp3. Blood. 2007;109:4368–4375. - PMC - PubMed
    1. Fontenot JD, Rasmussen JP, Gavin MA, Rudensky AY. A function for interleukin 2 in Foxp3-expressing regulatory T cells. Nature immunology. 2005;6:1142–1151. - PubMed

MeSH terms

Substances

LinkOut - more resources