

Research and Development Spending to Bring a Single Cancer Drug to Market and Revenues After Approval
- PMID: 28892524
- PMCID: PMC5710275
- DOI: 10.1001/jamainternmed.2017.3601
Research and Development Spending to Bring a Single Cancer Drug to Market and Revenues After Approval
Erratum in
-
Typographical Errors in the Table.JAMA Intern Med. 2017 Nov 1;177(11):1703. doi: 10.1001/jamainternmed.2017.6218. JAMA Intern Med. 2017. PMID: 29052708 Free PMC article. No abstract available.
-
Missing Conflict of Interest Disclosure.JAMA Intern Med. 2018 Oct 1;178(10):1433. doi: 10.1001/jamainternmed.2018.3298. JAMA Intern Med. 2018. PMID: 30105397 Free PMC article. No abstract available.
Abstract
Importance: A common justification for high cancer drug prices is the sizable research and development (R&D) outlay necessary to bring a drug to the US market. A recent estimate of R&D spending is $2.7 billion (2017 US dollars). However, this analysis lacks transparency and independent replication.
Objective: To provide a contemporary estimate of R&D spending to develop cancer drugs.
Design, setting, and participants: Analysis of US Securities and Exchange Commission filings for drug companies with no drugs on the US market that received approval by the US Food and Drug Administration for a cancer drug from January 1, 2006, through December 31, 2015. Cumulative R&D spending was estimated from initiation of drug development activity to date of approval. Earnings were also identified from the time of approval to the present. The study was conducted from December 10, 2016, to March 2, 2017.
Main outcomes and measures: Median R&D spending on cancer drug development.
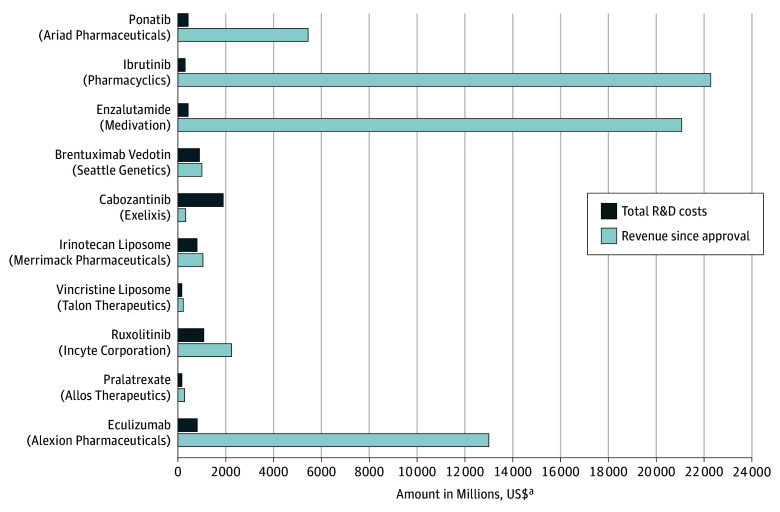
Results: Ten companies and drugs were included in this analysis. The 10 companies had a median time to develop a drug of 7.3 years (range, 5.8-15.2 years). Five drugs (50%) received accelerated approval from the US Food and Drug Administration, and 5 (50%) received regular approval. The median cost of drug development was $648.0 million (range, $157.3 million to $1950.8 million). The median cost was $757.4 million (range, $203.6 million to $2601.7 million) for a 7% per annum cost of capital (or opportunity costs) and $793.6 million (range, $219.1 million to $2827.1 million) for a 9% opportunity costs. With a median of 4.0 years (range, 0.8-8.8 years) since approval, the total revenue from sales of these 10 drugs since approval was $67.0 billion compared with total R&D spending of $7.2 billion ($9.1 billion, including 7% opportunity costs).
Conclusions and relevance: The cost to develop a cancer drug is $648.0 million, a figure significantly lower than prior estimates. The revenue since approval is substantial (median, $1658.4 million; range, $204.1 million to $22 275.0 million). This analysis provides a transparent estimate of R&D spending on cancer drugs and has implications for the current debate on drug pricing.
Conflict of interest statement
Figures
Comment in
-
A Much-Needed Corrective on Drug Development Costs.JAMA Intern Med. 2017 Nov 1;177(11):1575-1576. doi: 10.1001/jamainternmed.2017.4997. JAMA Intern Med. 2017. PMID: 28892523 No abstract available.
-
Assessing Pharmaceutical Research and Development Costs.JAMA Intern Med. 2018 Apr 1;178(4):587. doi: 10.1001/jamainternmed.2017.8703. JAMA Intern Med. 2018. PMID: 29610869 No abstract available.
-
Assessing Pharmaceutical Research and Development Costs.JAMA Intern Med. 2018 Apr 1;178(4):587-588. doi: 10.1001/jamainternmed.2017.8706. JAMA Intern Med. 2018. PMID: 29610870 No abstract available.
-
Methods Used to Assess Pharmaceutical Research and Development Costs.JAMA Intern Med. 2018 Apr 1;178(4):589. doi: 10.1001/jamainternmed.2018.0110. JAMA Intern Med. 2018. PMID: 29610873 No abstract available.
-
Assessing Pharmaceutical Research and Development Costs-Reply.JAMA Intern Med. 2018 Apr 1;178(4):588-589. doi: 10.1001/jamainternmed.2017.8737. JAMA Intern Med. 2018. PMID: 29610885 No abstract available.
-
Inconsistent Reporting of Potential Conflicts of Interest.JAMA Intern Med. 2018 Oct 1;178(10):1424-1425. doi: 10.1001/jamainternmed.2018.3695. JAMA Intern Med. 2018. PMID: 30105361 No abstract available.
References
-
- Mailankody S, Prasad V. Five years of cancer drug approvals: innovation, efficacy, and costs. JAMA Oncol. 2015;1(4):539-540. - PubMed
-
- Wertheimer A, Bush P. Ask the pharmacists: sticker shock at the pharmacy counter. phillycom. 2017. http://www.philly.com/philly/health/Ask-the-pharmacists-Sticker-shock-at.... Accessed July 31, 2017.
-
- Prasad V, De Jesús K, Mailankody S. The high price of anticancer drugs: origins, implications, barriers, solutions. Nat Rev Clin Oncol. 2017;14(6):381-390. - PubMed
Publication types
MeSH terms
Substances
LinkOut - more resources
Full Text Sources
Other Literature Sources
