

Patterns of Sedentary Behavior and Mortality in U.S. Middle-Aged and Older Adults: A National Cohort Study
- PMID: 28892811
- PMCID: PMC5961729
- DOI: 10.7326/M17-0212
Patterns of Sedentary Behavior and Mortality in U.S. Middle-Aged and Older Adults: A National Cohort Study
Abstract
Background: Excessive sedentary time is ubiquitous in Western societies. Previous studies have relied on self-reporting to evaluate the total volume of sedentary time as a prognostic risk factor for mortality and have not examined whether the manner in which sedentary time is accrued (in short or long bouts) carries prognostic relevance.
Objective: To examine the association between objectively measured sedentary behavior (its total volume and accrual in prolonged, uninterrupted bouts) and all-cause mortality.
Design: Prospective cohort study.
Setting: Contiguous United States.
Participants: 7985 black and white adults aged 45 years or older.
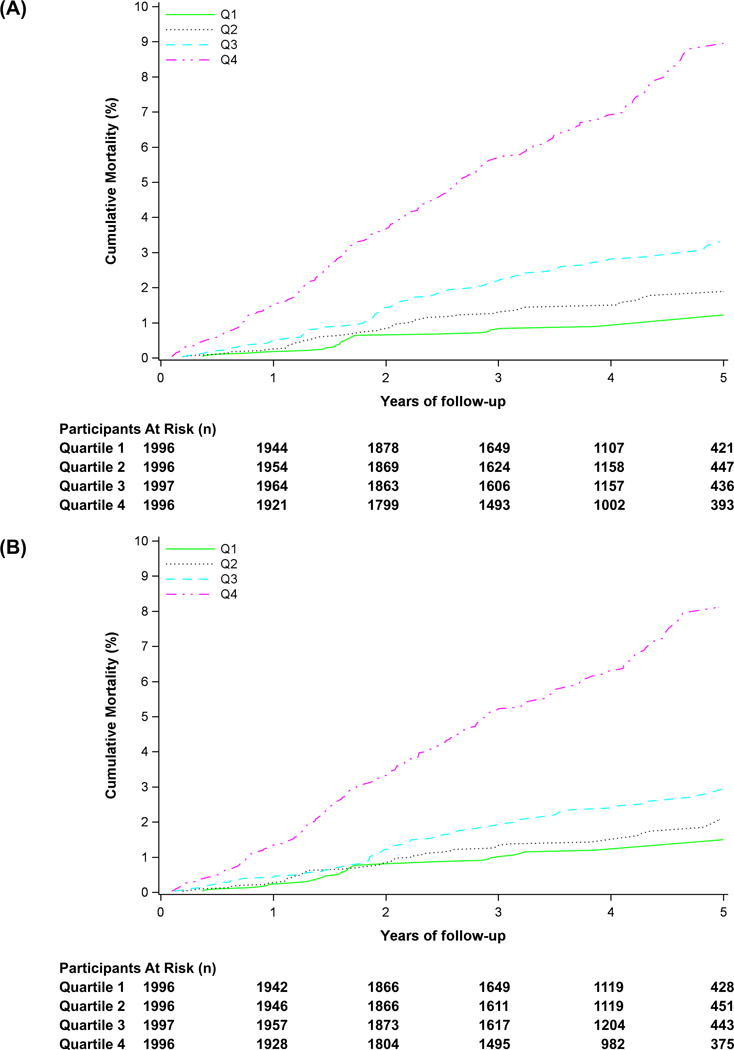
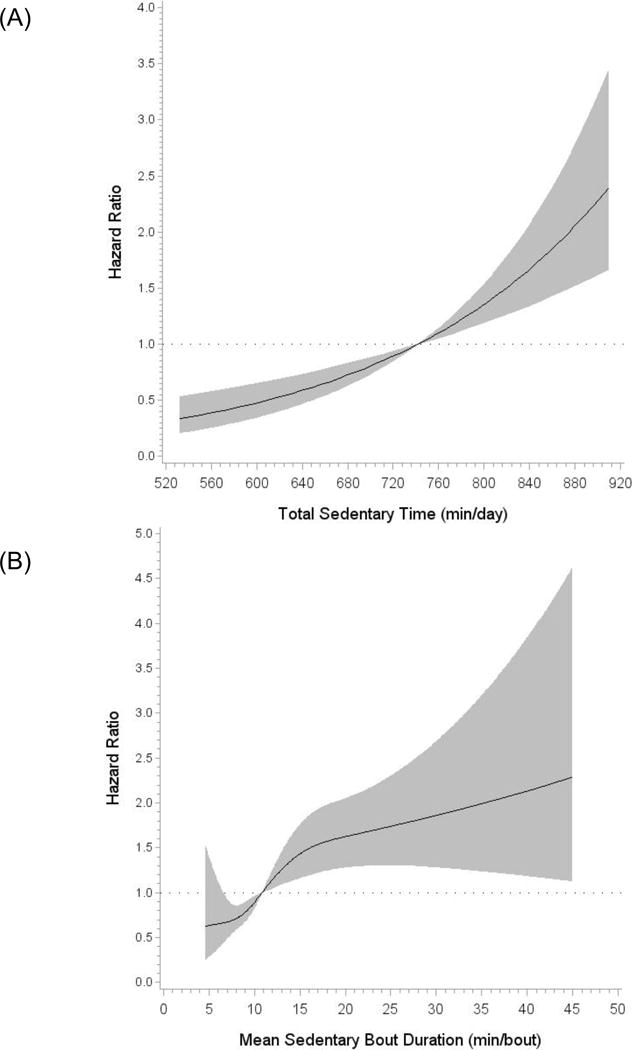
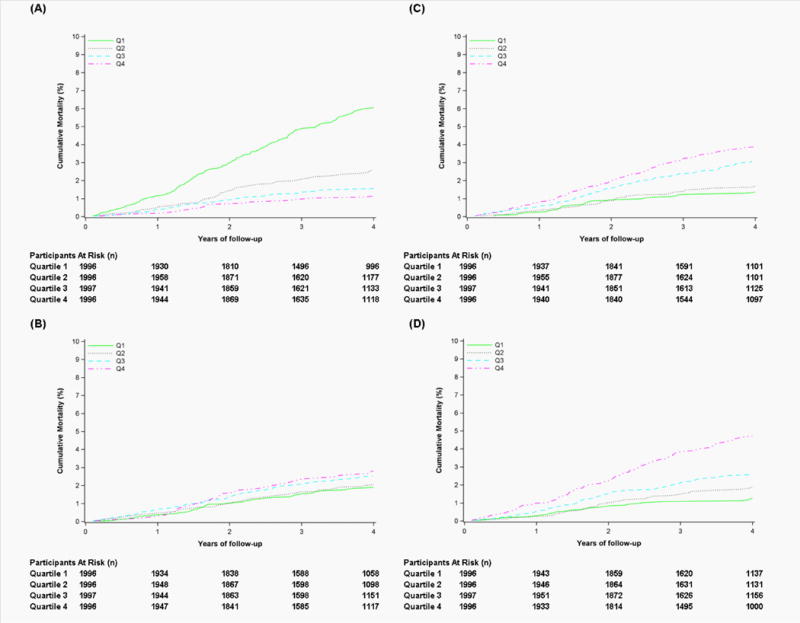
Measurements: Sedentary time was measured using a hip-mounted accelerometer. Prolonged, uninterrupted sedentariness was expressed as mean sedentary bout length. Hazard ratios (HRs) were calculated comparing quartiles 2 through 4 to quartile 1 for each exposure (quartile cut points: 689.7, 746.5, and 799.4 min/d for total sedentary time; 7.7, 9.6, and 12.4 min/bout for sedentary bout duration) in models that included moderate to vigorous physical activity.
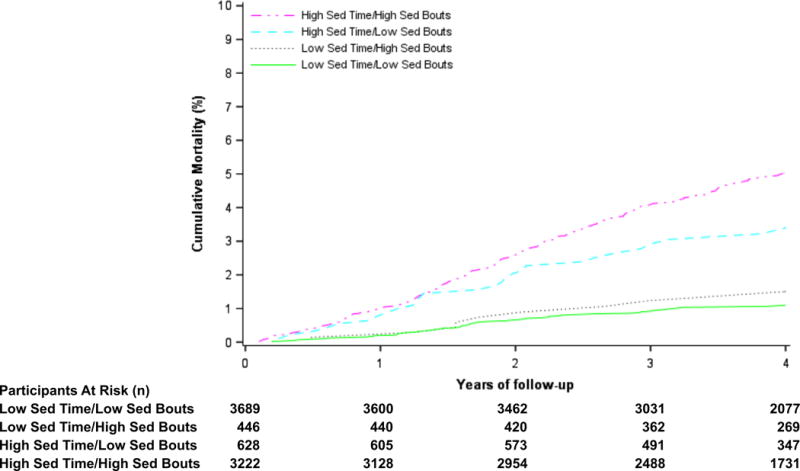
Results: Over a median follow-up of 4.0 years, 340 participants died. In multivariable-adjusted models, greater total sedentary time (HR, 1.22 [95% CI, 0.74 to 2.02]; HR, 1.61 [CI, 0.99 to 2.63]; and HR, 2.63 [CI, 1.60 to 4.30]; P for trend < 0.001) and longer sedentary bout duration (HR, 1.03 [CI, 0.67 to 1.60]; HR, 1.22 [CI, 0.80 to 1.85]; and HR, 1.96 [CI, 1.31 to 2.93]; P for trend < 0.001) were both associated with a higher risk for all-cause mortality. Evaluation of their joint association showed that participants classified as high for both sedentary characteristics (high sedentary time [≥12.5 h/d] and high bout duration [≥10 min/bout]) had the greatest risk for death.
Limitation: Participants may not be representative of the general U.S. population.
Conclusion: Both the total volume of sedentary time and its accrual in prolonged, uninterrupted bouts are associated with all-cause mortality, suggesting that physical activity guidelines should target reducing and interrupting sedentary time to reduce risk for death.
Primary funding source: National Institutes of Health.
Conflict of interest statement
Figures
Comment in
-
Tracking Our Physical Inactivity and Progression to Death: Is This Evolutionary Stagnation?Ann Intern Med. 2017 Oct 3;167(7):513-514. doi: 10.7326/M17-2181. Epub 2017 Sep 12. Ann Intern Med. 2017. PMID: 28892823 No abstract available.
Summary for patients in
-
Duration of Sedentary Episodes Is Associated With Risk for Death.Ann Intern Med. 2017 Oct 3;167(7). doi: 10.7326/P17-9045. Epub 2017 Sep 12. Ann Intern Med. 2017. PMID: 28892830 No abstract available.
References
-
- Dunstan DW, Howard B, Healy GN, Owen N. Too much sitting–a health hazard. Diabetes Res Clin Pract. 2012;97(3):368–76. - PubMed
-
- Yeager S. Sitting is the new smoking - even for runner. Runner’s World. 2013 retrieved from http://www.runnersworld.com/health/sitting-is-the-new-smoking-even-for-r... in June 2016.
-
- Strurt D, Nordstrom T. Is sitting the new smoking? Forbes. 2015 retrieved from http://www.forbes.com/sites/davidsturt/2015/01/13/is-sitting-the-new-smo... in June 2016.
-
- Gerstacker D. Sitting is the new smoking: ways a sedentary lifestyle is killing you. Huffington Post. 2014 retrieved from http://www.huffingtonpost.com/the-active-times/sitting-is-the-new-smokin... in June 2016.
-
- Biswas A, Oh PI, Faulkner GE, Bajaj RR, Silver MA, Mitchell MS, et al. Sedentary time and its association with risk for disease incidence, mortality, and hospitalization in adults: a systematic review and meta-analysis. Ann Intern Med. 2015;162(2):123–32. - PubMed
MeSH terms
Grants and funding
LinkOut - more resources
Full Text Sources
Other Literature Sources
Medical