. 2017 Sep 12:6:e26602.
doi: 10.7554/eLife.26602.

Induced sensorimotor cortex plasticity remediates chronic treatment-resistant visual neglect

Affiliations

Induced sensorimotor cortex plasticity remediates chronic treatment-resistant visual neglect

Jacinta O'Shea et al. Elife. .

Abstract

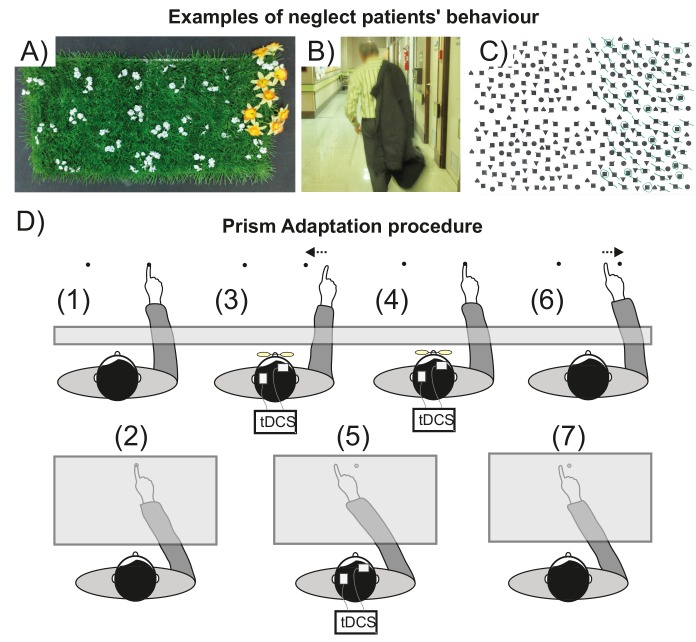
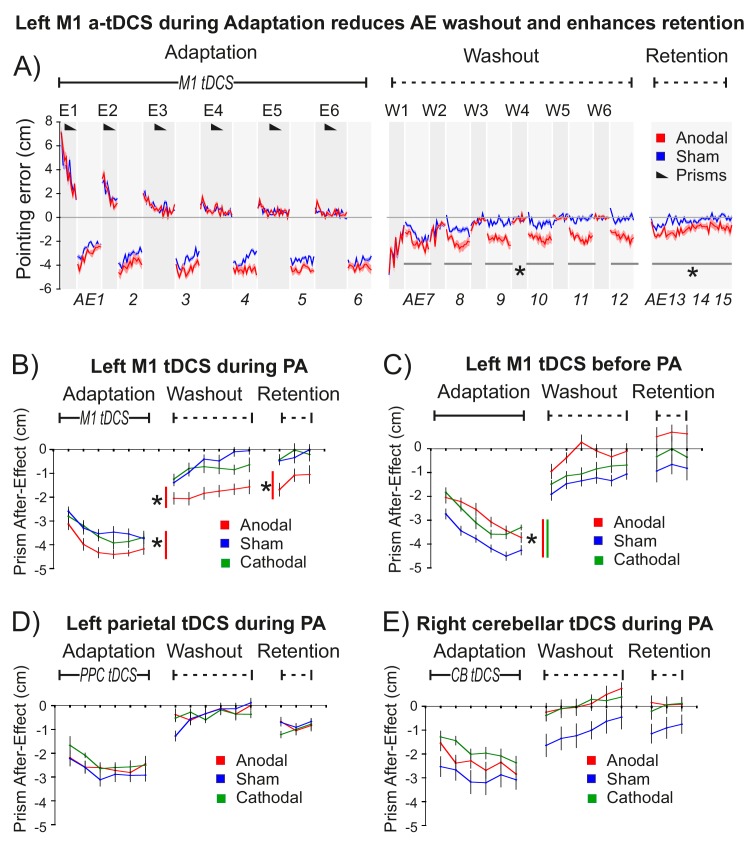
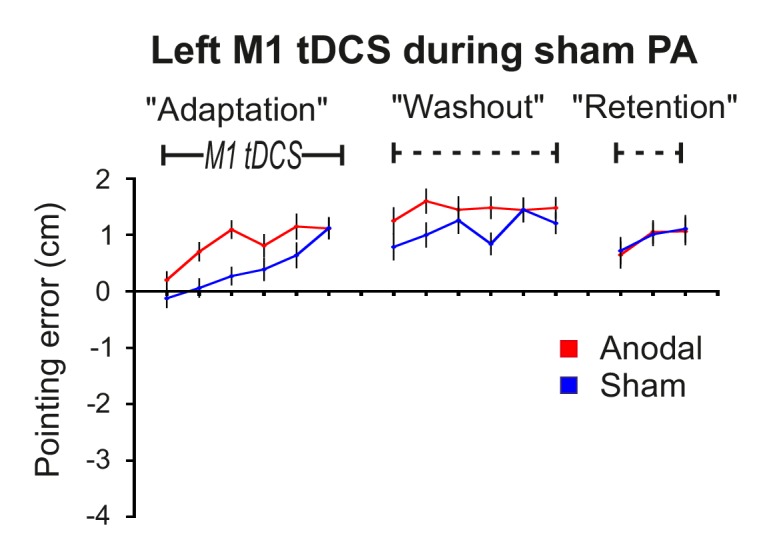
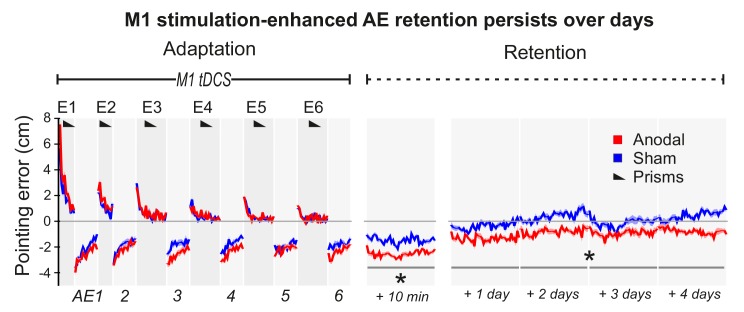
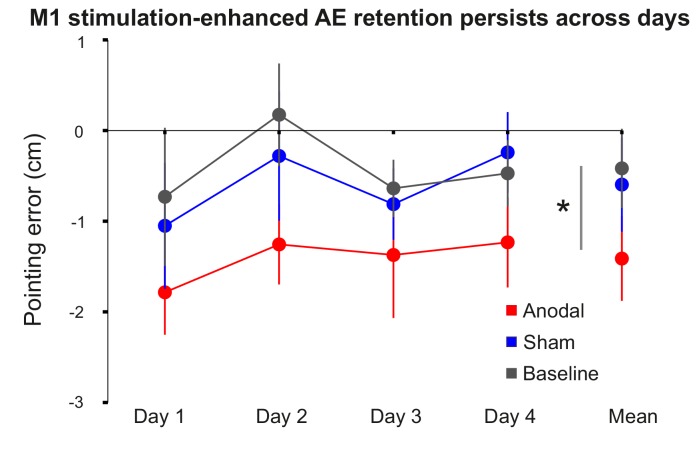
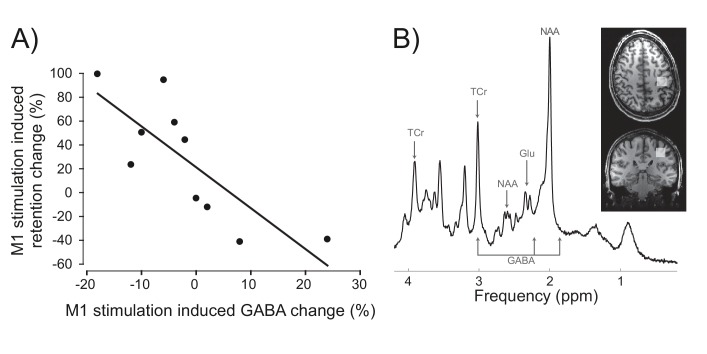
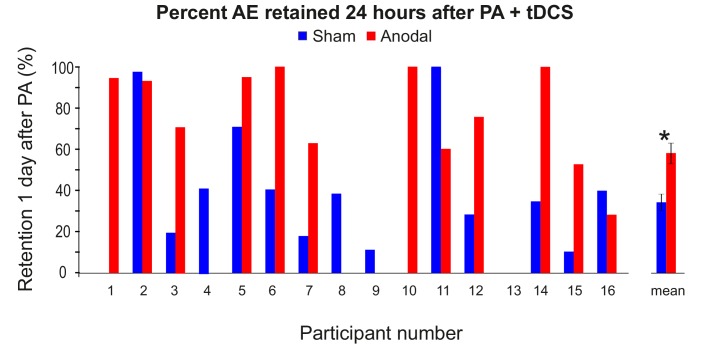
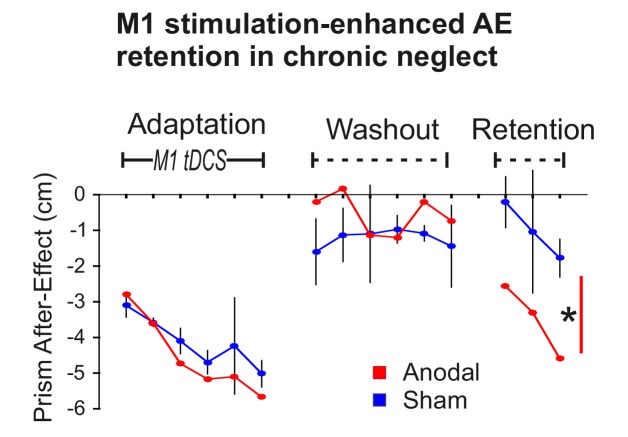
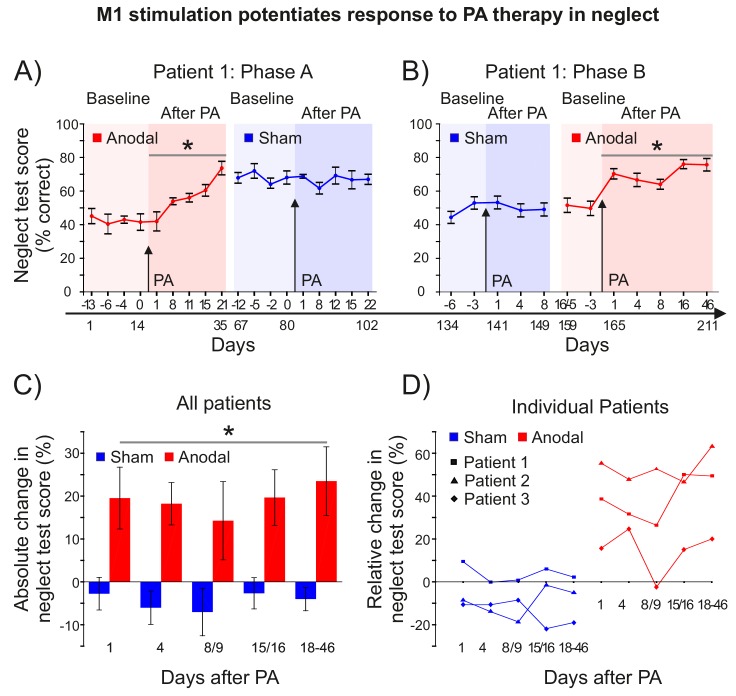
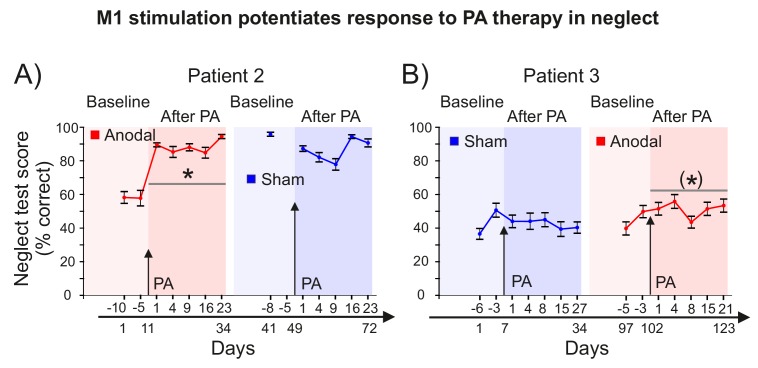
Right brain injury causes visual neglect - lost awareness of left space. During prism adaptation therapy, patients adapt to a rightward optical shift by recalibrating right arm movements leftward. This can improve left neglect, but the benefit of a single session is transient (~1 day). Here we show that tonic disinhibition of left motor cortex during prism adaptation enhances consolidation, stabilizing both sensorimotor and cognitive prism after-effects. In three longitudinal patient case series, just 20 min of combined stimulation/adaptation caused persistent cognitive after-effects (neglect improvement) that lasted throughout follow-up (18-46 days). Moreover, adaptation without stimulation was ineffective. Thus stimulation reversed treatment resistance in chronic visual neglect. These findings challenge consensus that because the left hemisphere in neglect is pathologically over-excited it ought to be suppressed. Excitation of left sensorimotor circuits, during an adaptive cognitive state, can unmask latent plastic potential that durably improves resistant visual attention deficits after brain injury.

Keywords: human; motor memory consolidation; neglect rehabilitation; neuroscience; prism adaptation.


Conflict of interest statement

Reviewing editor, eLife.

No competing interests declared.

Figures

Figure 1.
Figure 1.. Visuospatial neglect and prism adaptation.
(A–C) Examples of neglect behavior by patients in the present study. (A) Gardening task: arrange the flowers uniformly around the garden; (B) patient has neglected the left of his body; (C) Ota-Girardi task: cancel all targets on the page. (D) Prism Adaptation. (1) Baseline: visual feedback. Participants make rapid centre-out pointing movements to targets located at 10 degrees left or right. Vision of the hand start position is occluded. (2) Baseline: no visual feedback. Participants point at a central target. Vision of the hand is occluded throughout. (3) Adaptation: early prism exposure. Participants repeat (1) wearing 10° right-shifting prisms and initially make large rightward pointing errors. They use error feedback to correct their movements from right to left. (4) Adaptation: late prism exposure. After sustained prism exposure participants successfully realign hand-eye coordination leftward to regain baseline accuracy (i.e. they adapt). (5) Adaptation: prism after-effect. As participants adapt, this induces a leftward bias (prism after-effect), measured as the change from baseline (2). (6) Washout. After prism removal when participants point as in (1), the effect of adaptation is seen as a leftward error that is quickly corrected to restore baseline accuracy. (7) Retention. The magnitude of any remaining prism after-effect is measured as in (2).
Figure 2.
Figure 2.. M1 a-tDCS during Prism Adaptation (PA) enhanced consolidation of the prism after-effect.
The x-axis represents baseline accuracy (zero error), with prism after-effect (AE) data representing changes from baseline. For each panel N = 9. Asterisk indicates significant difference between Anodal and Sham (p<0.05). (A) Pointing accuracy in healthy volunteers when anodal (red) or sham (blue) tDCS was applied to M1 during Adaptation (Experiment 1). Black wedges indicate blocks throughout which prisms were worn. During Adaptation (prism exposure, (E1–E6) and Washout (prisms removed, (W1–W6), participants saw the outcome of the trial, so could correct their errors. The AE was measured without visual feedback (AE1-15, shaded light grey). Solid lines show pointing accuracy averaged across participants (shading =±1 SEM). Adaptation and Washout lasted 20 min each. Retention lasted 6 min after 10 min of blindfolded rest. Relative to sham, anodal tDCS increased AE persistence throughout Washout and Retention: note the leftward shift in AE7-15 (no visual feedback), whereas accuracy in interleaved blocks W1-6 is indistinguishable. (B–E) Prism after-effect in different stimulation conditions. Panel (B) summarizes group mean AEs (±1 SEM) for the dataset shown in (A) (AE1-15 only) and also shows data for reversed polarity stimulation (cathodal, green). Other panels plot the same summary AE data for stimulation of: (C) M1 before Adaptation (Experiment 2); (D) right posterior parietal cortex (PPC) during Adaptation (Experiment 3); E) right cerebellum (CB) during Adaptation (Experiment 4).
Figure 2—figure supplement 1.
Figure 2—figure supplement 1.. Control experiment 5: M1 a-tDCS alone does not cause a leftward shift in pointing behavior.
Data are group mean open-loop pointing errors (±1 SEM; N = 10) for sham and anodal tDCS conditions in the identical behavioural protocol to that shown in Figure 2 (ie: Adaptation, Washout, Retention) except that sham (not prism) glasses were used (Experiment 5). There is no leftward shift in pointing behavior in either condition. This confirms that M1 a-tDCS alone does not induce the sustained leftward shift in pointing behavior shown in Figure 2A,B and Figure 3.
Figure 3.
Figure 3.. M1 a-tDCS during Adaptation enhanced prism after-effect retention across days.
Pointing errors in healthy volunteers (N = 10) when anodal (red) or sham (blue) stimulation was applied during Adaptation (Experiment 6). Compared to the experiment of Figure 2A, there was no active washout phase. Instead, retention was measured daily over 5 days after adaptation. Solid lines show pointing accuracy averaged across participants (±1 SEM, shading). As in the experiment shown in Figure 2A, the AE persisted throughout the measured retention period only when M1 a-tDCS had been applied during Adaptation. Asterisks indicate significantly larger AEs in the anodal versus sham condition throughout Retention (p<0.05).
Figure 3—figure supplement 1.
Figure 3—figure supplement 1.. M1 stimulation-enhanced retention persists across days.
Figure shows group mean open-loop pointing errors (±1 SEM) over 4 days prior to prism adaptation (baseline), and 4 days after PA +sham tDCS (blue) or anodal tDCS (red). Pointing is significantly left-shifted in the 4 days after M1 anodal tDCS compared to both the sham and baseline conditions. Asterisk reflects p<0.05.
Figure 4.
Figure 4.. Inter-individual differences in neurochemical response to stimulation (M1 GABA change) co-varied with changes in prism after-effect retention caused by M1 a-tDCS.
(A) Experiment 7: X-axis shows individuals' percent change in GABA concentration after M1 a-tDCS (post-pre), quantified as ratios of total creatine. Y-axis shows individuals' percent change in AE retention 24 hr after PA + tDCS (anodal-sham). Correlation (N = 10) shows quantitative covariation between the behavioural and neurochemical effects of M1 a-tDCS. Note the data pass through the origin. (B) Representative image for a single participant showing voxel placement in the hand knob region of M1 and spectral quality. Frequency spectrum labels (ppm = parts per million) indicate peaks for GABA, Glutamate (Glu), total Creatine (TCr = creatine + phosphocreatine) and N-acetylaspartate (NAA).
Figure 4—figure supplement 1.
Figure 4—figure supplement 1.. AE retention scores (%) 24 hr after PA was combined with anodal or sham tDCS in Experiment 7.
Bars represent individuals and group mean ±1 SEM (N = 16). Apparently missing bars represent zero retention. Participants 1–10 also had usable MRS data and are shown in the behavior-neurochemistry correlation in Figure 4. Figure 4 plots the anodal-sham difference in retention ratios.
Figure 4—figure supplement 2.
Figure 4—figure supplement 2.. MRS data from occipital cortex voxel in Experiment 7.
Representative image for a single participant showing voxel placement in the occipital cortex (control region). Frequency spectrum labels (ppm = parts per million) indicate peaks for GABA, Glutamate (Glu), total Creatine (TCr = creatine + phosphocreatine) and N-acetylaspartate (NAA).
Figure 5.
Figure 5.. Stimulation-enhanced retention in chronic neglect.
The prism after-effect over time for anodal (red) and sham (blue) stimulation of M1 during Adaptation in a single case neglect patient (Patient 1). Data are displayed as described for Figure 2B except that sham data are the mean (±95% confidence intervals) across 3 sessions of the protocol, and anodal data are from a single session. AE retention was significantly enhanced by stimulation in this neglect patient, similar to the healthy volunteers shown in Figure 2A,B. Asterisk indicates significantly greater retention for the planned contrast of anodal versus sham in Retention blocks 1 and 3 (*p<0.001).
Figure 6.
Figure 6.. Patients' Lesion Anatomy.
(A–C) T1-weighted structural scans of Patients 1–3, respectively. (D) Grey matter lesion overlap between the three patients in group mean MNI space. (E) ‘Disconnectome map’ shows white matter damage overlap between the three patients. Red indicates white matter damage overlap in all three patients in the right inferior fronto-occipital fasciculus (rIFOF), the right superior longitudinal fasciculus (rSLF) and the right anterior thalamic radiation (rATR).
Figure 7.
Figure 7.. M1 stimulation during PA leads to lasting improvements in neglect.
(A) Behavioural measures of neglect in a single case chronic neglect patient (Patient 1) before and after PA sessions combining M1 anodal (red) and sham (blue) stimulation during adaptation. Datapoints are mean % neglect score ±1 SEM. A score of ~50% indicates the patient completed the rightmost half of the six tests in the battery. (B) As (A), but with a different battery of 10 neglect test measures, reversal of the order of anodal and sham stimulation, and no Washout phase during prism adaptation. (C, D) Percentage changes in performance on a battery of neglect tests over time after PA +M1 a-tDCS, averaged across all three patients (±1 SEM) (C), and for each individual case (D). Asterisks indicate significant improvement in neglect score after PA +M1 a-tDCS compared to sham (p<0.05).
Figure 7—figure supplement 1.
Figure 7—figure supplement 1.. M1 stimulation during PA leads to lasting improvements in neglect.
(A) Behavioural measures of neglect in Patient 2 before and after PA sessions combining M1 anodal (red) and sham (blue) stimulation during adaptation. Data are mean % neglect score ±1 SEM. A baseline score of ~60% indicates the patient completed the rightmost two thirds of the 10 tests in the battery. One of the sham baseline scores is missing for Patient 2 as he forgot to attend testing. Asterisk indicates significant improvement in neglect score after PA +M1 a-tDCS compared to sham (p<0.05). (B) As (A), but for Patient 3, who underwent the reversed order of PA +anodal versus sham stimulation. Bracketed asterisk indicates significant improvement in neglect score after PA +M1 a-tDCS, but the contrast of anodal versus sham was not significant.

References

    1. Adamson J, Beswick A, Ebrahim S. Is stroke the most common cause of disability? Journal of Stroke and Cerebrovascular Diseases. 2004;13:171–177. doi: 10.1016/j.jstrokecerebrovasdis.2004.06.003. - DOI - PubMed
    1. Barrett AM, Goedert KM, Basso JC. Prism adaptation for spatial neglect after stroke: translational practice gaps. Nature Reviews Neurology. 2012;8:567–577. doi: 10.1038/nrneurol.2012.170. - DOI - PMC - PubMed
    1. Block H, Bastian A, Celnik P. Virtual lesion of angular gyrus disrupts the relationship between visuoproprioceptive weighting and realignment. Journal of Cognitive Neuroscience. 2013;25:636–648. doi: 10.1162/jocn_a_00340. - DOI - PMC - PubMed
    1. Bowen A, Hazelton C, Pollock A, Lincoln NB. Cognitive rehabilitation for spatial neglect following stroke. The Cochrane database of systematic reviews. 2013;7:CD003586. doi: 10.1002/14651858.CD003586.pub3. - DOI - PMC - PubMed
    1. Buch ER, Santarnecchi E, Antal A, Born J, Celnik PA, Classen J, Gerloff C, Hallett M, Hummel FC, Nitsche MA, Pascual-Leone A, Paulus WJ, Reis J, Robertson EM, Rothwell JC, Sandrini M, Schambra HM, Wassermann EM, Ziemann U, Cohen LG. Effects of tDCS on motor learning and memory formation: A consensus and critical position paper. Clinical Neurophysiology. 2017;128:589–603. doi: 10.1016/j.clinph.2017.01.004. - DOI - PubMed

Publication types