. 2018 Apr 1:169:23-45.
doi: 10.1016/j.neuroimage.2017.09.009. Epub 2017 Sep 8.

Adaptive cortical parcellations for source reconstructed EEG/MEG connectomes

Affiliations

Adaptive cortical parcellations for source reconstructed EEG/MEG connectomes

Seyedeh-Rezvan Farahibozorg et al. Neuroimage. .

Abstract

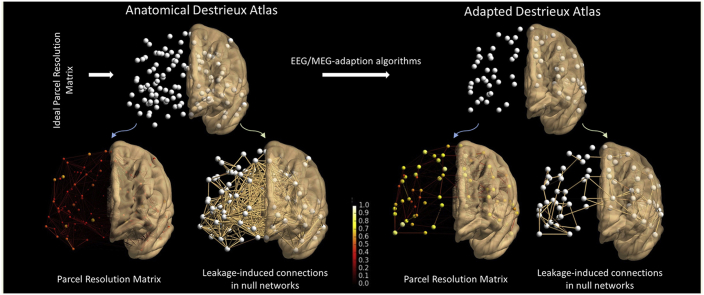
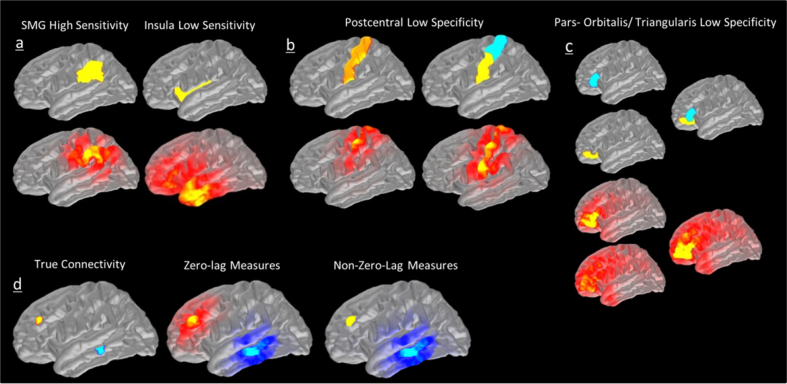
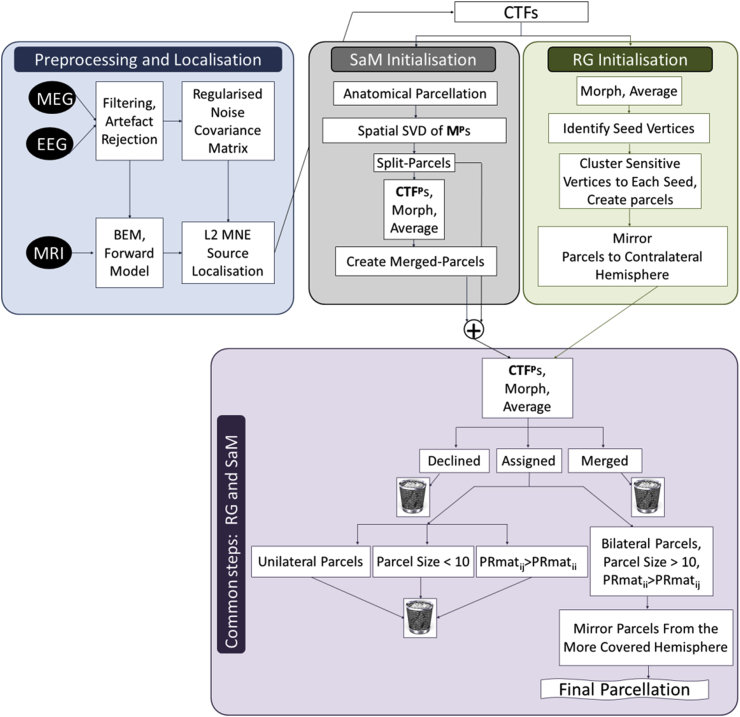
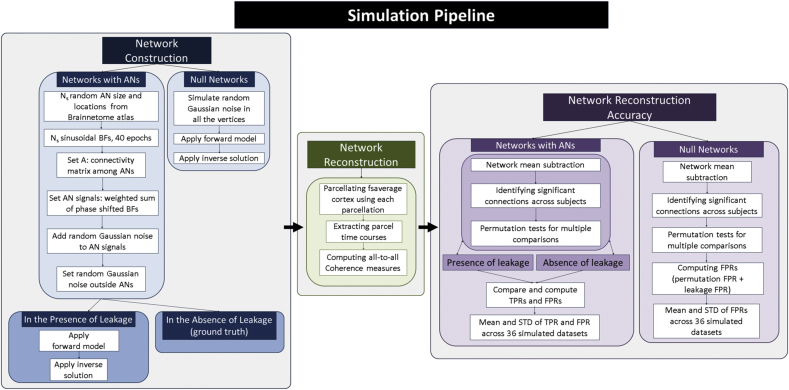
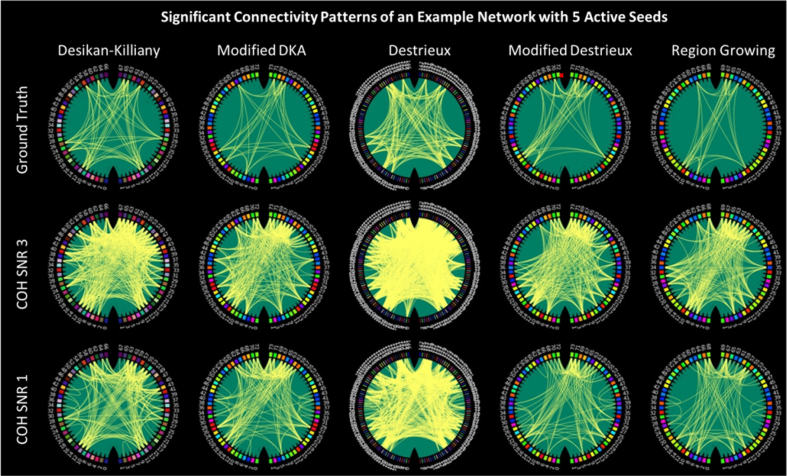
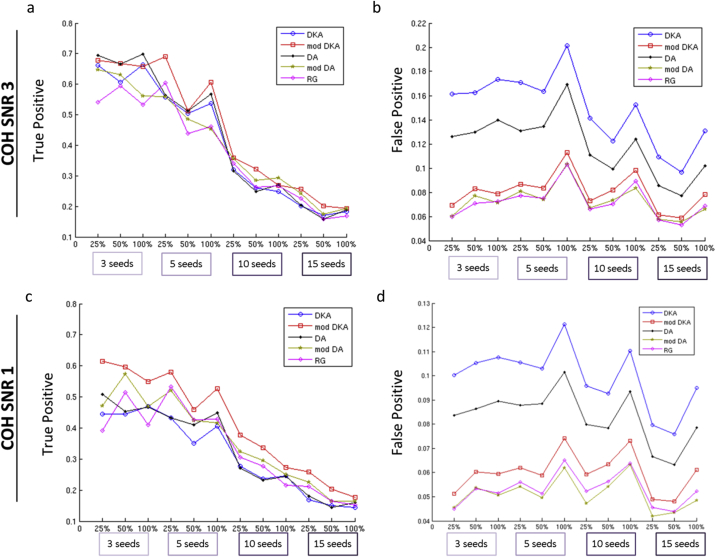
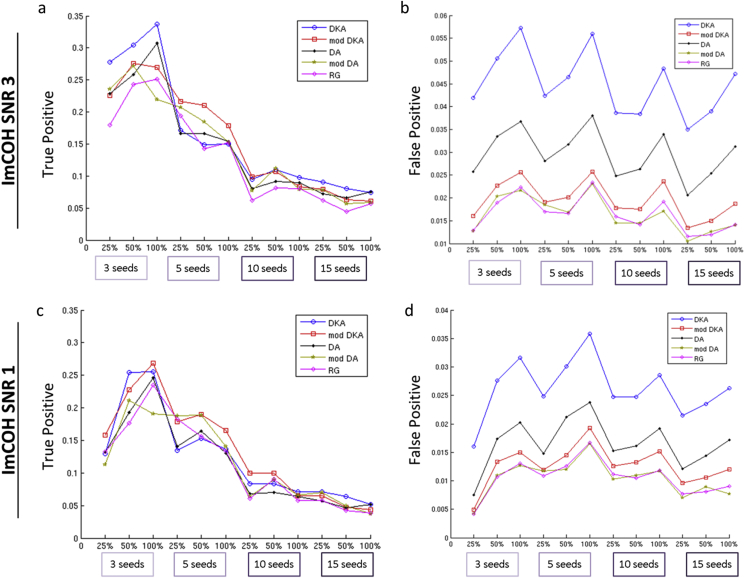
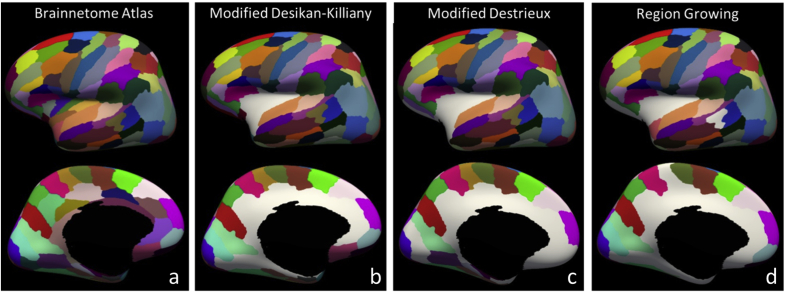
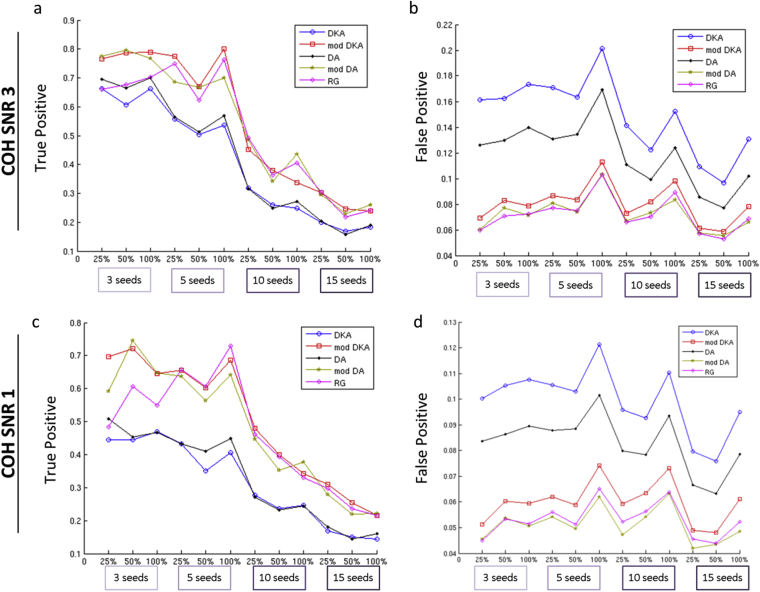
There is growing interest in the rich temporal and spectral properties of the functional connectome of the brain that are provided by Electro- and Magnetoencephalography (EEG/MEG). However, the problem of leakage between brain sources that arises when reconstructing brain activity from EEG/MEG recordings outside the head makes it difficult to distinguish true connections from spurious connections, even when connections are based on measures that ignore zero-lag dependencies. In particular, standard anatomical parcellations for potential cortical sources tend to over- or under-sample the real spatial resolution of EEG/MEG. By using information from cross-talk functions (CTFs) that objectively describe leakage for a given sensor configuration and distributed source reconstruction method, we introduce methods for optimising the number of parcels while simultaneously minimising the leakage between them. More specifically, we compare two image segmentation algorithms: 1) a split-and-merge (SaM) algorithm based on standard anatomical parcellations and 2) a region growing (RG) algorithm based on all the brain vertices with no prior parcellation. Interestingly, when applied to minimum-norm reconstructions for EEG/MEG configurations from real data, both algorithms yielded approximately 70 parcels despite their different starting points, suggesting that this reflects the resolution limit of this particular sensor configuration and reconstruction method. Importantly, when compared against standard anatomical parcellations, resolution matrices of adaptive parcellations showed notably higher sensitivity and distinguishability of parcels. Furthermore, extensive simulations of realistic networks revealed significant improvements in network reconstruction accuracies, particularly in reducing false leakage-induced connections. Adaptive parcellations therefore allow a more accurate reconstruction of functional EEG/MEG connectomes.

Keywords: Adaptive parcellation; Cross-talk functions; Functional connectome; MEG/EEG; Source reconstruction; Whole-brain connectivity.


Figures

Image 1
Graphical abstract
Fig. 1
Fig. 1
A CTF-based illustration of the limitations of the use of anatomical parcellations for EEG/MEG analysis in source space. a) CTFs (bottom) for some parcels (e.g. supramarginal gyrus, left) peak within the parcel, while for others (e.g. a deep parcel in the insula) the CTF's peak may be at a significant distance from the parcel. b) A single postcentral parcel produces potentially multiple distinguishable CTFs. c) Pars-orbitalis and Pars-triangularis (yellow and blue, respectively) are anatomically separate but have largely overlapping CTFs. d) An illustration of how seed-based connectivity is affected by the leakage problem in a hypothetical task where only two regions in RMF (seed) and MTG (target) are active and non-zero-lag connected. Left: ideal scenario with no leakage. Middle: in the presence of leakage if a method of connectivity that is sensitive to the zero-lag connections (e.g. coherence) is used. Right: in the presence of leakage if a method of connectivity that is insensitive to the zero-lag connections (imaginary part of coherency) is used. This figure is based on theoretical predictions of CTFs of the connectivity results rather than simulations.
Fig. 2
Fig. 2
A flowchart of data analysis and parcellation algorithms. Preprocessing and localisation steps can change depending on the study and CTFs and subsequent steps will change and adapt accordingly. Mp: a subset of R matrix corresponding to each parcel, CTFp: CTFs of each parcel at all the brain vertices, PRmat: parcel resolution matrix, RG: Region Growing, SaM: Split and Merge.
Fig. 3
Fig. 3
Flowchart of the simulation pipeline consisting of three main steps of network construction, network reconstruction and network reconstruction accuracy. AN: Active node, BF: Basis function, TPR: True positive rate, FPR: False positive rate, STD: standard deviation.
Fig. 4
Fig. 4
a) Anatomical Desikan-Killiany Atlas with 68 parcels bilaterally; b) Parcel Resolution Matrix (PRmat) of Desikan-Killiany Atlas. Rows show average normalised CTF of each parcel at every other parcel (Equation (6)). c) Anatomical Destrieux Atlas with 146 parcels bilaterally; d) PRmat of Destrieux Atlas. Colour labels along rows and columns of the PRmats correspond to those used for the parcellations.
Fig. 5
Fig. 5
Final adaptive parcellations (left) and PRmats (right) for a) SaM modification of Desikan-Killiany Atlas; b) SaM modification of Destrieux Atlas; c) Region growing algorithm.
Fig. 6
Fig. 6
Normalised overlaps between the parcels obtained from different parcellation algorithms. Modified Desikan-Killiany parcellation is shown on the x-axis and is used as the reference, (the order of parcels on the x-axis corresponds to Fig. 5a). Y-axis represents the parcels in a) modified Destrieux and b) RG parcellations. The rows correspond to the colour-matched regions of the x-axis and therefore the order is arbitrary in comparison to Fig. 5b and c. The sums of the normalised overlaps in each row are also shown as the first column.
Fig. 7
Fig. 7
a) Significant connections of the null networks reconstructed based on the anatomical and modified parcellations. The ratios of the leakage-induced connections (false positives) to all possible connections were found to be 0.101 and 0.081 in DKA and DA atlases that were reduced to 0.038, 0.031 and 0.024 in the modified DKA, modified DA and RG parcellations respectively. Node colours correspond to the node colours in Figs. 4 and 5. b) Variations of FPRs for null networks of each parcellation across 36 simulated datasets (boxplots mark median (red lines), standard deviations (in blue), confidence interval (in black) and outliers (red cross).
Fig. 8
Fig. 8
Significant connections for an example network with 5 active seeds. The first row shows the ground truth in the absence of leakage, the second and third rows show the network in the presence of leakage under SNR 3 and 1 respectively, as computed using coherence. Node colours correspond to the node colours in Figs. 4 and 5.
Fig. 9
Fig. 9
Comparison of anatomical and modified parcellations based on true positive (left) and false positive rates (right) of coherence analysis of simulated networks with active nodes at SNRs a, b) 3.0 and c, d) 1.0. The reference for each parcellation is the reconstructed network in the absence of leakage. TPRs (left) and FPRs (right) are obtained by comparing each reconstructed network in the presence of leakage to the reference network for the same parcellation. COH: Coherence, SNR: Signal-to-noise ratio, DKA: Desikan-Killiany atlas, DA: Destrieux atlas, mod: modified, RG: Region Growing.
Fig. 10
Fig. 10
Comparison of anatomical and adaptive parcellations based on true positive (left) and false positive rates (right) obtained from ImCOH analysis of simulated networks with active nodes at SNRs a, b) 3.0 and c, d) 1.0. The reference for each parcellation is the reconstructed network in the absence of leakage. ImCOH: Imaginary part of Coherency, SNR: Signal-to-noise ratio, DKA: Desikan-Killiany Atlas, DA: Destrieux Atlas. Mod: Modified.
Fig. B1
Fig. B1
a) Brainnetome functional atlas from which the active nodes (ANs) of the simulated networks are randomly drawn. Parcels of the Brainnetome atlas that show overlap with any of the parcels of the modified b) Desikan-Killiany, c) Destrieux and d) Region Growing parcellations are shown in colour and parcels with no overlaps are masked in white.
Fig. B2
Fig. B2
TPRs and FPRs before taking the missed connections due to no coverage of some parts of the cortex in adaptive parcellations into account. That is, we compared parcellation-specific ground truths (e.g. first row in Fig. 8) in the absence of leakage to the realistic networks in the presence of leakage (without considering calculations in section 3.4.2.1). Left panel, TPRs: a) at SNR 3, TPRs were reduced as the number of seeds/connections increased. For the anatomical parcellations, starting from ∼0.7 true positives for 3 seeds, TPR was reduced to ∼0.5 for 5 seeds, and then dropped sharply to 0.3 or less for 10 and 15. We found a similar trend for the modified parcellations, except that 1) for all the seeds/connections, modified parcellations showed significantly higher TPRs than anatomical parcellations (c.f. Table B1 for details) and 2) for 3 and 5 seeds, the TPR remained relatively constant at around 0.75 and then dropped to 0.4 or less for 10 seeds or more. We found no significant difference between the TPRs of the three modified parcellations. c) Both SNRs showed a similar trend, but (as elaborated in Table B1), the TPRs at SNR 1 where on average lower by approximately 10% and 6% compared to those at SNR 3, for anatomical and modified parcellations respectively. b, d) FPRs: FPRs are the same as Fig. 9 and are presented here for the sake of completeness.
Fig. C1
Fig. C1
Initial results of the parcellation algorithms. a) split and b) merged parcels from the Desikan-Killiany Atlas. The primary splitting procedure for this parcellation resulted in 194 split parcels and merging procedure resulted in 122 merged parcels; these sets of parcels formed an intermediate parcellation that was input into the final homogeneity check for final vertex assignment (section 3.3.2). From this figure, it can be seen that larger parcels (e.g. pre-/post-central and temporal regions) were split into several sub-parcels. Additionally, vertices that are located at the intersection of adjacent parcels were typically clustered together to form merged parcels. While some of these clusters survive as new parcels in the final parcellation (Fig. 5), others are removed, leaving gaps between the neighbouring parcels which results in a sparse sampling of the cortex to maximise the distinguishability in the final parcellation. c) split and d) merged parcels from Destrieux Atlas. The initial splitting procedure for this parcellation resulted in 428 parcels and merging procedure in 280 extra parcels (overall 708 parcels) compared to 316 parcels for the Desikan-Killiany atlas. e) “Created” parcels from the region growing algorithm. These created parcels were mirrored to the right hemisphere using MNI coordinates and where put through an SaM algorithm as described in section 3.3.3.

Similar articles

Cited by

References

    1. Backus G.E., Gilbert J.F. Uniqueness in the inversion of inaccurate Gross earth data. Philosoph. Trans. R. Astron. Soc. Lond. A. 1970;266:123–192.
    1. Barnes G.R. A verifiable solution to the MEG inverse problem. NeuroImage. 2006;31(2):623–626. - PubMed
    1. Bastos A.M., Schoffelen J.-M. A tutorial review of functional connectivity analysis methods and their interpretational pitfalls. Front. Syst. Neurosci. 2016;9:1–23. - PMC - PubMed
    1. Brookes M.J. A multi-layer network approach to MEG connectivity analysis. NeuroImage. 2016;132:425–438. - PMC - PubMed
    1. Brookes M.J. Investigating the electrophysiological basis of resting state networks using magnetoencephalography. Proc. Natl. Acad. Sci. U. S. A. 2011;108(40):16783–16788. - PMC - PubMed

Publication types

MeSH terms

LinkOut - more resources