. 2017 Jul 27;125(7):077020.
doi: 10.1289/EHP1029.

Exposure to Ambient Particulate Matter during Specific Gestational Periods Produces Adverse Obstetric Consequences in Mice

Affiliations

Exposure to Ambient Particulate Matter during Specific Gestational Periods Produces Adverse Obstetric Consequences in Mice

Jason L Blum et al. Environ Health Perspect. .

Abstract

Background: Epidemiological studies associate inhalation of fine-sized particulate matter (PM2.5) during pregnancy with preterm birth (PTB) and low birth weight (LBW) but disagree over which time frames are most sensitive, or if effects are cumulative.

Objectives: Our objective was to provide experimental plausibility for epidemiological observations by testing the hypothesis that exposure to PM2.5 during discrete periods of pregnancy results in PTB and LBW.

Methods: For the first study, timed-pregnant B6C3F1 mice were exposed to concentrated ambient PM2.5 (CAPs) or filtered air (FA) throughout pregnancy [6 h/d from gestational day (GD) 0.5 through GD16.5]. A follow-up study examined the effects of CAPs exposure during discrete gestational periods (1: GD0.5–5.5; 2: GD6.5–14.5; 3: GD14.5–16.5; 4: GD0.5–16.5) aligning to milestones during human development.

Results: In the first experiment, exposure to 160 μg CAPs/m3 throughout pregnancy decreased gestational term by 0.5 d (∼1.1 wk decrease for humans) and birth weight by 11.4% compared with FA. The follow-up experiment investigated timing of CAPs exposure (mean concentrations at 178, 193, 171, and 173 μg/m3 for periods 1–4, respectively). Pregnancy was significantly shortened (vs. FA) by ∼0.4d when exposure occurred during gestational periods 2 and 4, and by ∼0.5d if exposure occurred during period 3. Exposure during periods 1, 2, and 4 reduced birth weight by ∼10% compared with FA, and placental weight was reduced (∼8%) on GD17.5 if exposure occurred only during period 3.

Conclusions: Adverse PM2.5-induced outcomes such as PTB and LBW are dependent upon the periods of maternal exposure. The results of these experimental studies could contribute significantly to air pollution policy decisions in the future. https://doi.org/10.1289/EHP1029.


Figures

Timeline indicating four gestational exposure periods.
Figure 1.
Timeline for inhalation CAPs exposure. Upon arrival, female mice were staged for phase of the estrous cycle. On the third proestrus following two normal cycles, the female was paired with a single male to breed overnight. Upon confirmation of breeding, the female was weighed and assigned to a treatment and to an exposure period. Exposures were 6 h/d, 7 d/wk. Dams were weighed daily before being placed into the exposure box if being exposed or returned to the home cage if not being exposed. Mice from all periods were either euthanized on GD17.5 or allowed to give birth as described in “Methods.” Note: CAPs, concentrated ambient PM2.5 (fine-sized particulate matter); NYU, New York University.
Bar graphs A and C with confidence intervals plotting gestational day (y-axis) across treatment groups, namely, naïve, control, and CAPS, and control and CAPS, respectively, (x-axis). Bar graphs B and D with confidence intervals plotting birth weight in milligrams (y-axis) across treatment groups, namely, naïve, control, and CAPS, and control and CAPS, respectively, (x-axis).
Figure 2.
Maternal exposure to inhaled CAPs results in preterm birth and low birth weight. Dams were exposed to CAPs during period 4 (GD0.5–16.5) and were allowed to give birth. Data are from experiment 1 (A, B) and experiment 2 (C, D). In experiment 1, some naïve dams (n=4) were used to control for changes resulting from the exposure system. Data for experiment 1 are the means±standarderror(SE) from n=10 (FA) or n=15 (CAPs); for experiment 2, n=22 for each treatment. In all panels, the treatment effect is significant [analysis of variance (ANOVA) p<0.05]. Bars in panels A and B with different letters are significantly different based on Fisher’s Least Significant Difference (LSD) post hoc testing. Note: CAPs, concentrated ambient PM2.5 (fine-sized particulate matter); FA, filtered air. *p<0.05 based on ANOVA.
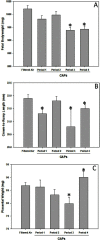
Bar graphs A, B, and C with confidence intervals plotting fetal body weight in milligrams, crown to rump length in millimeters, and placental weight in milligrams (y-axis), respectively, across exposure to filtered air and four gestational exposure periods (x-axis).
Figure 3.
Exposure of pregnant mice to CAPs during different exposure periods (experiment 3) is associated with decreased body weight (A), decreased CRL (B), and altered placental weight (C) on GD17.5. The results from analysis of variance (ANOVA) showed significant differences (p<0.05) among the groups for each endpoint which was followed by Fisher’s Least Significant Difference (LSD) post hoc testing to determine differences compared with FA. Data are the means±standarderror(SE) from n=5 dams from each CAPs exposure period or n=16 from the pooled FA control dams. Note: CAPs, concentrated ambient PM2.5 (fine-sized particulate matter); CRL, crown-to-rump length; FA, filtered air; GD, gestational day. *p<0.05 compared with FA dams based on post hoc testing.
Bar graphs A, B, C, and D with confidence intervals plotting day of birth in gestational day, mean birth weight in milligrams, mean birth length in millimeters, and mean weight/length ratio in milligrams per millimeter (y-axis), respectively, across exposure to filtered air and four gestational exposure periods (x-axis).
Figure 4.
Maternal exposure to inhaled CAPs during different periods of pregnancy in experiment 3 as described in “Methods” are associated with PTB (A), LBW (B), decreased CRL (C) and decreased SGA (D). The results from analysis of variance (ANOVA) showed significant differences (p<0.05) among the groups for each end point; ANOVA was followed by Fisher’s Least Significant Difference (LSD) post hoc testing to determine differences compared with FA. Data are the means±standarderror(SE) from n=811 dams for CAPs-exposed mice during periods 1 – 4. Because no differences were observed among the four periods for FA control values, the values were pooled (n=26). Note: CAPs, concentrated ambient PM2.5 (fine-sized particulate matter); CRL, crown-to-rump length; FA, filtered air; LBW, low birth weight; PTB, preterm birth; SGA, size for gestational age. *p<0.05 compared with FA dams based on post hoc testing.
Line graphs A and B with confidence interval plotting body weight gain and weight gain (y-axis), respectively, across days postpartum (x-axis) exposed to filtered air and four gestational exposure periods.
Figure 5.
Exposure of pregnant mice does not affect growth rates of offspring (experiment 3). Neonatal body weight gain was computed as a percentage over birth weight (A) or daily body weight gain (percent day-to-day gain) (B). Analysis of percent weight gain compared to birth weight (A) showed no significant differences by ANOVA (p>0.05) for the interaction of treatment and time. Comparison of weight gain day-to-day (B) also revealed no significant differences among the groups when data were analyzed by day postpartum. Data are means±SE from 8–11 dams for each CAPs exposure Period and 26 dams for the pooled FA controls.
Bar graphs A and B with confidence intervals plotting body length in millimeters ranging from 36 to 44 (in 6A) and from 46 to 58 (in 6B), (y-axis) across exposure to filtered air and four gestational exposure periods (x-axis). Bar graphs C and D with confidence intervals plotting anogenital distance in millimeters ranging from 1 to 4 (in 4C) and 7.5 to 10 (in 4D) (y-axis) across exposure to filtered air and four gestational exposure periods (x-axis).
Figure 6.
Exposure of pregnant mice to CAPs during different pregnancy periods results in alterations in CRL and AGD in male offspring on PND10 and PND21. CRLs of male offspring were measured on PND10 and PND21 (A, B), and AGDs were measured at these same time points (C, D). The results from analysis of variance (ANOVA) showed significant differences (p<0.05) among the groups for each end point; ANOVA was followed by Fisher’s Least Significant Difference (LSD) post hoc testing to determine specific differences among the groups. Data presented are the means±standarderror(SE) from n=811 dams for each CAPs exposure period and n=26 dams for the pooled FA controls. Bars with different letters are significantly different from one another (p<0.05). Note: AGD, anogenital distance; CAPs, concentrated ambient PM2.5 (fine-sized particulate matter); CRL, crown-to-rump length; FA, filtered air; PND, postnatal day.
Bar graphs A and B with confidence intervals plotting body length in millimeters ranging from 36 to 44 (in 7A) and from 46 to 58 (in 7B), respectively, (y-axis) across exposure to filtered air and four gestational exposure periods (x-axis). Bar graphs C and D with confidence intervals plotting anogenital distance in millimeters ranging from 1 to 4 (in 7C) and 7.5 to 10 (in 7D) (y-axis) across exposure to filtered air and four gestational exposure periods (x-axis).
Figure 7.
Exposure of pregnant mice to CAPs during different pregnancy periods results in alterations in CRL and AGD in female offspring on PND10 and PND21. CRLs of female offspring were measured on PND10 and PND21 (A, B), and AGDs were measured at these same time points (C, D). The results from analysis of variance (ANOVA) showed significant differences (p<0.05) among the groups for each endpoint; ANOVA was followed by Fisher’s Least Significant Difference (LSD) post hoc testing to determine specific differences among the groups. Data presented are the means±standarderror(SE) from n=811 dams for each CAPs exposure period and n=26 dams for the pooled FA controls. Bars with different letters are significantly different from one another (p<0.05). Note: AGD, anogenital distance; CAPs, concentrated ambient PM2.5 (fine-sized particulate matter); CRL, crown-to-rump length; FA, filtered air; PND, postnatal day.
Tabular representation of mice gestational days, events, and human gestational days for the first, second, and third trimester.
Figure 8.
Alignment of mouse reproductive timeline to that of humans from the beginning of pregnancy through parturition. This table is based on Theiller stages of mouse development (Theiler 1989) and Carnegie stages of human development (O'Rahilly and Müller 2010).

Similar articles

Cited by

References

    1. Barker DJP, Bull AR, Osmond C, Simmonds SJ. 1990. Fetal and placental size and risk of hypertension in adult life. BMJ 301(6746):259–262, PMID: 2390618, 10.1136/bmj.301.6746.259. - DOI - PMC - PubMed
    1. Barker DJP, Hales CN, Fall CH, Osmond C, Phipps K, Clark PM. 1993a. Type 2 (non-insulin-dependent) diabetes mellitus, hypertension and hyperlipidaemia (syndrome X): relation to reduced fetal growth. Diabetologia 36(1):62–67, PMID: 8436255, 10.1007/bf00399095. - DOI - PubMed
    1. Barker DJP, Osmond C, Simmonds SJ, Wield GA. 1993b. The relation of small head circumference and thinness at birth to death from cardiovascular disease in adult life. BMJ 306(6875):422–426, PMID: 8461722, 10.1136/bmj.306.6875.422. - DOI - PMC - PubMed
    1. Barker DJP, Winter PD, Osmond C, Margetts B, Simmonds SJ. 1989. Weight in infancy and death from ischaemic heart disease. Lancet 2(8663):577–580, PMID: 2570282, 10.1016/S0140-6736(89)90710-1. - DOI - PubMed
    1. Basu R, Harris M, Sie L, Malig B, Broadwin R, Green R. 2014. Effects of fine particulate matter and its constituents on low birth weight among full-term infants in California. Environ Res 128:42–51, PMID: 24359709, 10.1016/j.envres.2013.10.008. - DOI - PubMed

Publication types

LinkOut - more resources