. 2017 Nov 30;130(22):2420-2430.
doi: 10.1182/blood-2017-03-770719. Epub 2017 Sep 11.

Topological analysis reveals a PD-L1-associated microenvironmental niche for Reed-Sternberg cells in Hodgkin lymphoma

Affiliations

Topological analysis reveals a PD-L1-associated microenvironmental niche for Reed-Sternberg cells in Hodgkin lymphoma

Christopher D Carey et al. Blood. .

Abstract

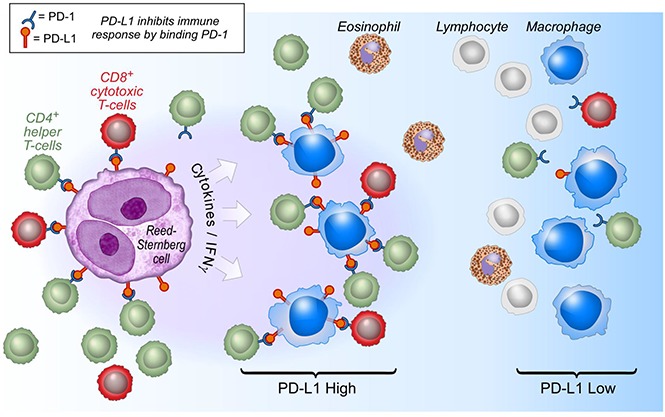
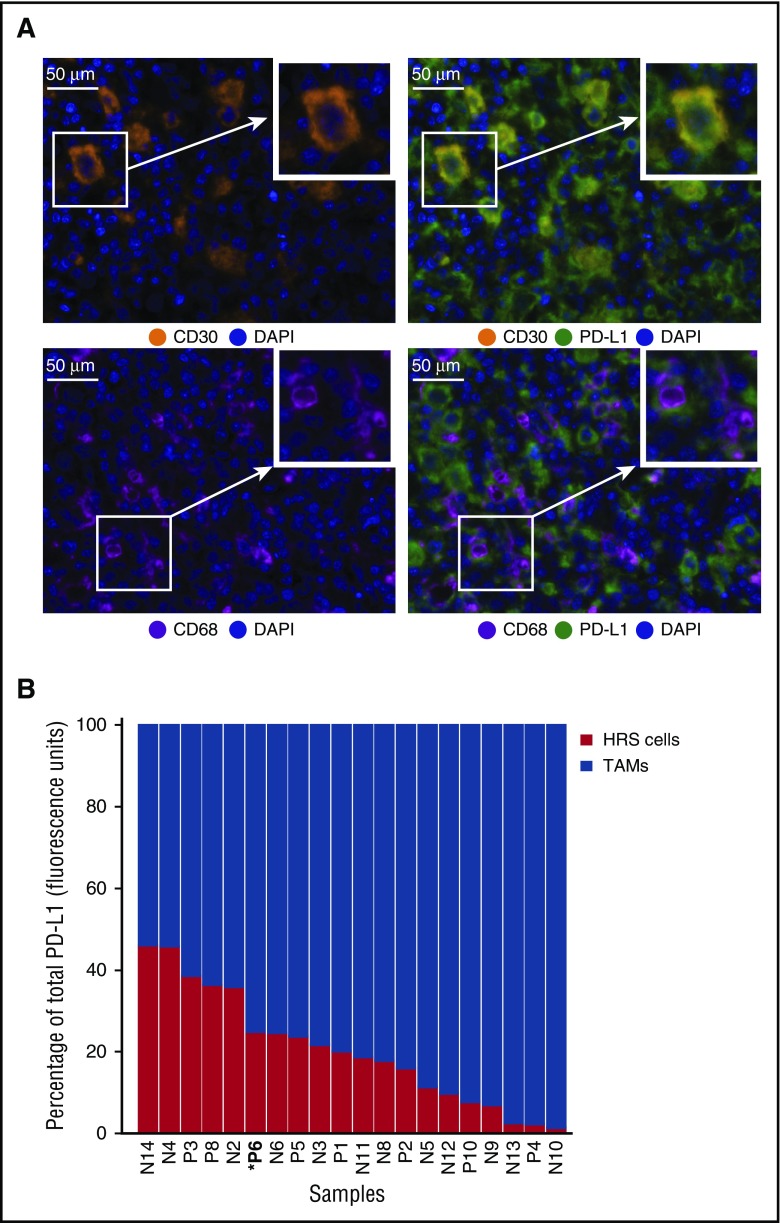
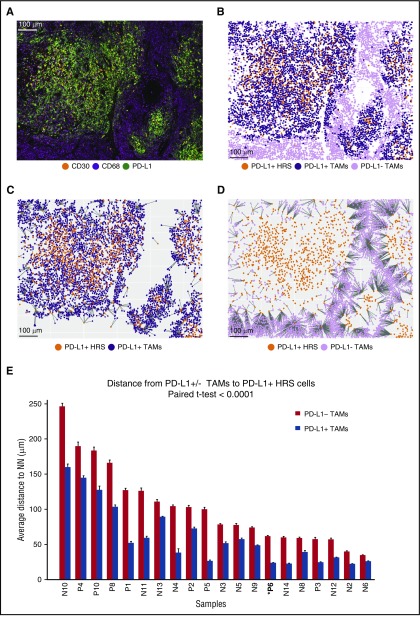
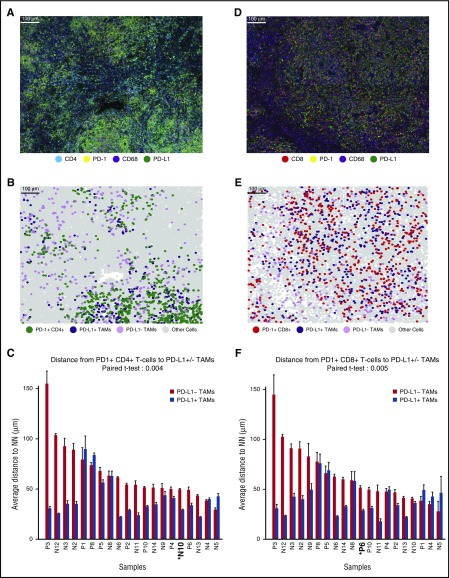
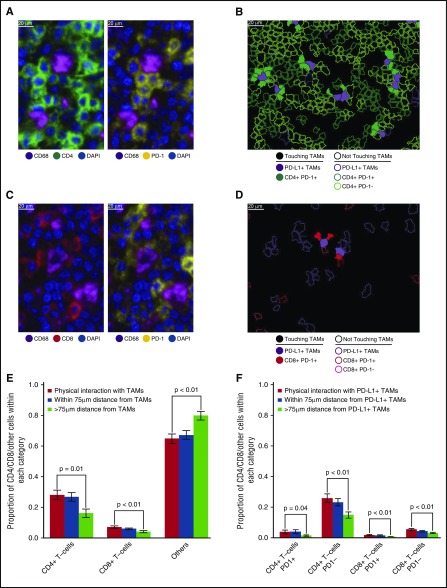
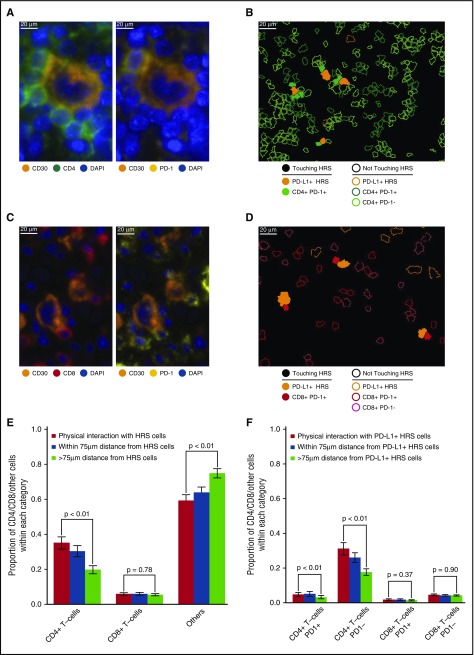
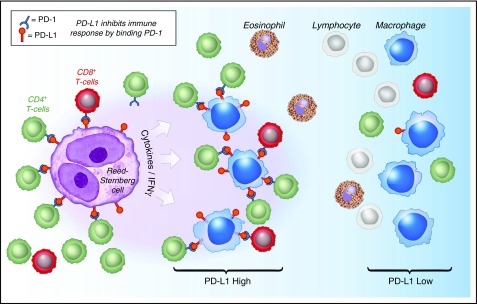
Signaling between programmed cell death protein 1 (PD-1) and the PD-1 ligands (PD-L1, PD-L2) is essential for malignant Hodgkin Reed-Sternberg (HRS) cells to evade antitumor immunity in classical Hodgkin lymphoma (cHL). Copy number alterations of 9p24.1/CD274(PD-L1)/PDCD1LG2(PD-L2) contribute to robust PD-L1 and PD-L2 expression by HRS cells. PD-L1 is also expressed by nonmalignant tumor-associated macrophages (TAMs), but the relationships among PD-L1+ HRS cells, PD-L1+ TAMs, and PD-1+ T cells remain undefined. We used multiplex immunofluorescence and digital image analysis to examine the topography of PD-L1+ and PD-1+ cells in the tumor microenvironment (TME) of cHL. We find that the majority of PD-L1 in the TME is expressed by the abundant PD-L1+ TAMs, which physically colocalize with PD-L1+ HRS cells in a microenvironmental niche. PD-L1+ TAMs are enriched for contacts with T cells, and PD-L1+ HRS cells are enriched for contacts with CD4+ T cells, a subset of which are PD-1+ Our data define a unique topology of cHL in which PD-L1+ TAMs surround HRS cells and implicate CD4+ T cells as a target of PD-1 blockade.


Figures

None
Graphical abstract
Figure 1.
Figure 1.
Expression of PD-L1 by HRS cells and TAMs. (A) Multiplex IF staining (40× resolution, case P6) for CD30 (top left, orange) to highlight HRS cells, CD68 (bottom left, magenta) to highlight TAMs, and PD-L1 (green) to show colocalization of PD-L1 and CD30 (top right, colocalization, yellow) and PD-L1 and CD68 (bottom right). Each image includes a nuclear counterstain/4′,6-diamidino-2-phenylindole (blue). (B) The relative amount of total PD-L1 per tumor (calculated as percentage of total fluorescence units), contributed by HRS cells (red) and TAMs (blue). The cases are ordered by the percentage of PD-L1 attributed to HRS cells, from highest to lowest. Cell lineage assignments (HRS cell; TAM) are based on pathologist-trained algorithms and include data from all fluorescent-channels (“Methods”). DAPI, 4′,6-diamidino-2-phenylindole.
Figure 2.
Figure 2.
Distances from PD-L1+TAMs and PD-L1TAMs to the nearest PD-L1+HRS cells. (A) Representative multiplex IF image (20× resolution; case P6) showing staining for CD30 (orange), CD68 (magenta), and PD-L1 (green). (B) Cellular phenotype map of the image shown in A depicting locations of PD-L1+ HRS cells (orange dots), PD-L1+ TAMs (purple dots), and PD-L1 TAMs (pink dots). (C) Ray plot depicting the distance from each PD-L1+ TAM to the nearest PD-L1+ HRS cell. (D) Ray plot depicting the distance from each PD-L1 TAM to the nearest PD-L1+ HRS cell. (E) The mean distances (microns) and standard errors for all 20 study tumors, divided into mean distance from PD-L1 TAMs to the nearest PD-L1+ HRS cells (red) and mean distance from PD-L1+ TAMs to the nearest PD-L1+ HRS cells (blue). The tumors are ordered by the distances from PD-L1 TAMs to PD-L1+ HRS cells, from highest to lowest. P value (<.0001) was calculated by paired Student t test. NN, nearest neighbor.
Figure 3.
Figure 3.
Distances from PD-1+CD4+and PD-1+CD8+T cells to the nearest PD-L1+TAMs. (A) Representative multiplex IF image (20× resolution; case N10) showing staining for CD4 (cyan), PD-1 (yellow), CD68 (magenta), and PD-L1 (green). (B) Cellular phenotype map of image shown in A depicting the locations of PD-1+ CD4+ T cells (green dots), PD-L1+ TAMs (purple dots), PD-L1 TAMs (pink dots), and undefined cells (gray dots). (C) The mean distances (microns) and standard errors for all 20 study tumors, divided into mean distance from PD-1+ CD4+ T cells to the nearest PD-L1+ TAMs (blue) and mean distance from PD-1+ CD4+ T cells to the nearest PD-L1 TAMs (red). Tumors are ordered by the distance between PD-1+ CD4+ T cells and PD-L1 TAMs, from highest to lowest. P value (.004) was calculated by paired Student t test. (D) Representative multiplex IF image (20× resolution; case P6) showing staining for CD8 (red), PD-1 (yellow), CD68 (magenta), and PD-L1 (green). (E) Cellular phenotype map of image shown in D depicting the locations of PD-1+ CD8+ T cells (red dots), PD-L1+ TAMs (purple dots), PD-L1 TAMs (pink dots), and undefined cells (gray dots). (F) The mean distances (microns) and standard error for all 20 study tumors, divided into mean distance from PD-1+ CD8+ T cells to the nearest PD-L1+ TAMs (blue) and mean distance from PD-1+ CD8+ T cells to the nearest PD-L1 TAMs (red). Tumors are ordered by the distance from PD-1+ CD8+ T cells to the nearest PD-L1 TAMs, from highest to lowest. P value (.005) was calculated by paired Student t test.
Figure 4.
Figure 4.
T-cell subsets in contact with TAMs. (A) Representative image (40× resolution; case N13) showing CD4+ T cells (left panel, green) with coexpression of PD-1 (right panel, yellow) touching CD68+ TAMs (left and right panels, magenta). (B) Membrane map depicting CD4+ T cells (PD-1+ dark green; PD-1 light green), and PD-L1+ TAMs (purple). Cells are generally only outlined, with the exceptions of PD-1+ CD4+ T cells and PD-L1+ TAMs that are in contact, which are filled to highlight the interaction. (C) Representative image (40× resolution; case N13) showing CD8+ T cells (left panel, red) with coexpression of PD-1 (right panel, yellow) touching CD68+ TAMs (left and right panels, magenta). (D) Membrane map depicting CD8+ T cells (PD-1+ dark red; PD-1 light red), and PD-L1+ TAMs (purple). Cells are generally only outlined, with the exceptions of PD-1+ CD8+ T cells and PD-L1+ TAMs that are in contact, which are filled. (E) Mean and standard error of the proportion of cells that are CD4+ T cells, CD8+ T cells, or undefined that are in contact with TAMs (red bars), within 75 µm of TAMs (blue bars), or more than 75 µm from TAMs (green bars), respectively. P values calculated by the Wilcoxon test. (F) Mean and standard error of the proportion of cells that are PD-1+ CD4+ T cells, PD-1 CD4+ T cells, PD-1+ CD8+ T cells, or PD-1 CD8+ T cells and that are in contact with PD-L1+ TAMs (red bars), within 75 µm of PD-L1+ TAMs (blue bars), or more than 75 µm from PD-L1+ TAMs (green bars), respectively. P values calculated by the Wilcoxon test.
Figure 5.
Figure 5.
T-cell subsets in contact with HRS cells. (A) Representative image (40× resolution; case N12) showing CD4+ T cells (left panel, green) with coexpression of PD-1 (right panel, yellow) touching a CD30+ HRS cell (left and right panels, orange). (B) Membrane map depicting CD4+ T cells (PD-1+ dark green; PD-1 light green), and PD-L1+ HRS cells (orange). Cells are generally only outlined, with the exceptions of PD-1+ CD4+ T cells and PD-L1+ HRS cells that are in contact, which are filled to highlight the interaction. (C) Representative image (40× resolution; case P6) showing CD8+ T cells (left panel, red) with coexpression of PD-1 (right panel, yellow) touching CD30+ HRS cells (left and right panels, orange). (D) Membrane map depicting CD8+ T cells (PD-1+ dark red; PD-1 light red), and PD-L1+ HRS cells (orange). Cells are generally only outlined, with the exceptions of PD-1+ CD8+ T cells and PD-L1+ HRS cells that are in contact, which are filled. (E) Mean and standard error of the proportion of cells that are CD4+ T cells, CD8+ T cells, or undefined and that are in contact with HRS cells (red bars), within 75 µm of HRS cells (blue bars), or more than 75 µm from the HRS cells (green bars), respectively. P values calculated by the Wilcoxon test. (F) Mean and standard error of the proportion of cells that are PD-1+ CD4+ T cells, PD-1 CD4+ T cells, PD-1+ CD8+ T cells, or PD-1 CD8+ T cells in contact with PD-L1+ HRS cells (red bars), within 75 µm of PD-L1+ HRS cells (blue bars), or more than 75 µm from PD-L1+ HRS cells (green bars), respectively. P values calculated by the Wilcoxon test.
Figure 6.
Figure 6.
Model of PD-1:PD-L1 Interactions in cHL. HRS cells (purple) express PD-L1 (and PD-L2) in part as a result of copy gain of chromosome 9p24.1 which includes PD-L1/PD-L2/JAK2. Tumor-associated macrophages (blue) that are in proximity to HRS cells express high levels of PD-L1, likely in response to local cytokine production, and thereby significantly increase the total amount of PD-L1 in the vicinity of the malignant cells. Both TAMs’ and HRS cells’ PD-L1 is available to bind PD-1 on CD4+ T cells (green) and CD8+ T cells (red). CD4+ T cells and PD-1+ CD4+ T cells are in greater numbers and are specifically enriched in the vicinity of PD-L1+ HRS cells compared with CD8+ T cells and PD-1+ CD8+ T cells and may indicate a preferential role for CD4+ T cells during PD-1 blockade. IFNγ, interferon-γ.

Comment in

References

    1. Swerdlow SH, Campo E, Harris NL, et al. . WHO Classification of Tumours of Haematopoietic and Lymphoid Tissues. Lyon: IARC; 2008.
    1. Green MR, Monti S, Rodig SJ, et al. . Integrative analysis reveals selective 9p24.1 amplification, increased PD-1 ligand expression, and further induction via JAK2 in nodular sclerosing Hodgkin lymphoma and primary mediastinal large B-cell lymphoma. Blood. 2010;116(17):3268-3277. - PMC - PubMed
    1. Roemer MGM, Advani RH, Ligon AH, et al. . PD-L1 and PD-L2 genetic alterations define classical Hodgkin lymphoma and predict outcome. J Clin Oncol. 2016;34(23):2690-2697. - PMC - PubMed
    1. Roemer MGM, Advani RH, Redd RA, et al. . Classical Hodgkin lymphoma with reduced β2M/MHC class I expression is associated with inferior outcome independent of 9p24.1 status. Cancer Immunol Res. 2016;4(11):910-916. - PMC - PubMed
    1. Reichel J, Chadburn A, Rubinstein PG, et al. . Flow sorting and exome sequencing reveal the oncogenome of primary Hodgkin and Reed-Sternberg cells. Blood. 2015;125(7):1061-1072. - PubMed

Publication types

MeSH terms