. 2017 Nov 22;61(12):e01334-17.
doi: 10.1128/AAC.01334-17. Print 2017 Dec.

Chemical Genetic Interaction Profiling Reveals Determinants of Intrinsic Antibiotic Resistance in Mycobacterium tuberculosis

Affiliations

Chemical Genetic Interaction Profiling Reveals Determinants of Intrinsic Antibiotic Resistance in Mycobacterium tuberculosis

Weizhen Xu et al. Antimicrob Agents Chemother. .

Abstract

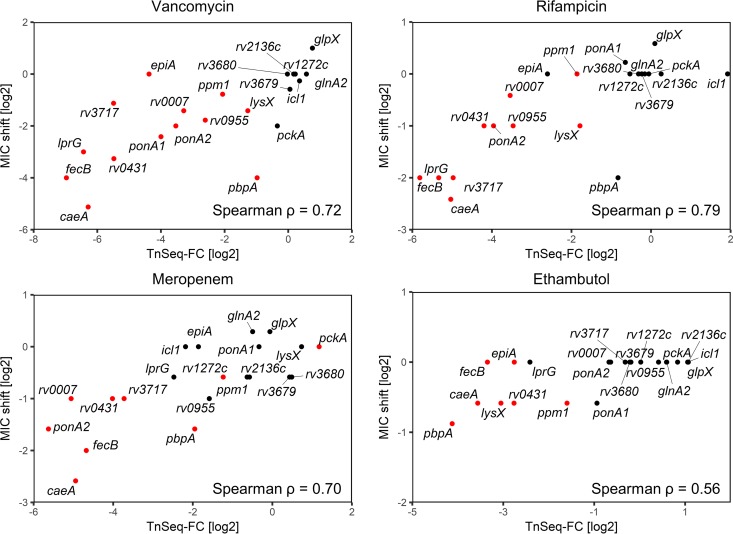
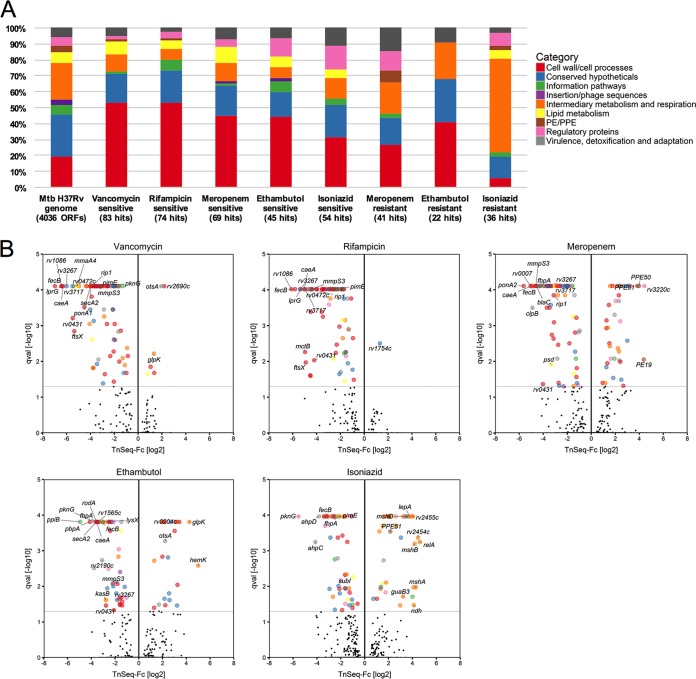
Chemotherapy for tuberculosis (TB) is lengthy and could benefit from synergistic adjuvant therapeutics that enhance current and novel drug regimens. To identify genetic determinants of intrinsic antibiotic susceptibility in Mycobacterium tuberculosis, we applied a chemical genetic interaction (CGI) profiling approach. We screened a saturated transposon mutant library and identified mutants that exhibit altered fitness in the presence of partially inhibitory concentrations of rifampin, ethambutol, isoniazid, vancomycin, and meropenem, antibiotics with diverse mechanisms of action. This screen identified the M. tuberculosis cell envelope to be a major determinant of antibiotic susceptibility but did not yield mutants whose increase in susceptibility was due to transposon insertions in genes encoding efflux pumps. Intrinsic antibiotic resistance determinants affecting resistance to multiple antibiotics included the peptidoglycan-arabinogalactan ligase Lcp1, the mycolic acid synthase MmaA4, the protein translocase SecA2, the mannosyltransferase PimE, the cell envelope-associated protease CaeA/Hip1, and FecB, a putative iron dicitrate-binding protein. Characterization of a deletion mutant confirmed FecB to be involved in the intrinsic resistance to every antibiotic analyzed. In contrast to its predicted function, FecB was dispensable for growth in low-iron medium and instead functioned as a critical mediator of envelope integrity.

Keywords: Mycobacterium tuberculosis; antibiotic resistance; cell envelope; mutational studies.


Figures

FIG 1
FIG 1
Identification of M. tuberculosis transposon mutants with altered antibiotic susceptibility. (A) Partially inhibitory antibiotic selection of transposon mutant libraries. Growth curves are representative of the growth kinetics of the transposon mutant libraries in the presence or absence of antibiotic selection. d, days. (B) Cluster analysis of CGI profiles. Hierarchical clustering was performed on the CGI profiles derived from triplicate experiments using Pearson's correlation as the similarity metric. The mean log2 TnSeq-FC in transposon mutant frequency for each gene following antibiotic selection relative to that for the antibiotic-free control is indicated on the color scale, with increased mutant representation being indicated in red and reduced representation being indicated in blue. Genes that did not exhibit statistically significant differences (i.e., q ≥ 0.05, based on resampling testing) in transposon insertion under any of the antibiotic selection conditions tested were omitted, and the 251 remaining genes were used in this analysis.
FIG 2
FIG 2
Genetic determinants of intrinsic antibiotic resistance are shared between different antibiotics. (A) Overlap between CGI profiles. The overlap matrix indicates the number of genes shared between pairs of antibiotic sensitivity profiles (numbers not in parentheses). The degree of overlap is represented in the form of the Jaccard index (numbers in parentheses), i.e., the proportion of sensitivity genes shared between the two libraries over the total number of genes from both libraries [(AB)/(AB), where A and B are different sets of sensitive mutants]. (B) Venn diagram of antibiotic-sensitive mutants. Sets of significantly sensitive mutants (negative TnSeq-FC, q < 0.05) for each antibiotic are represented by the colored regions, with the number of overlapping genes in their respective zones being indicated. RIF, rifampin; INH, isoniazid; EMB, ethambutol; MERO or MER, meropenem; VAN, vancomycin.
FIG 3
FIG 3
Validation of intrinsic antibiotic resistance genes with MIC measurements. The Spearman rank correlation (ρ) between the log2 fold change from the antibiotic TnSeq screen and the observed log2 MIC90 shift in knockout mutants is indicated. Log2 TnSeq-FC values are derived from triplicate experiments, while the MIC shifts shown are the means from duplicate experiments. Mutants predicted to be significantly underrepresented or enriched by the TnSeq screen (q < 0.05) are colored red.
FIG 4
FIG 4
Identification and functional categorization of genes related to intrinsic antibiotic resistance. (A) Proportions of sensitive and resistant mutants corresponding to the different functional categories as annotated in TubercuList (57). The overall functional composition of the M. tuberculosis (Mtb) H37Rv genome is displayed to the left of the chart as a point of reference. Data for vancomycin- and rifampin-resistant mutants are not displayed due to their small number. (B) TnSeq-FC- and false discovery rate-adjusted P values (q values [qval]) from the resampling test are plotted for each genetic locus. Loci meeting the significance threshold of a q value of <0.05 are colored according to their functional categories. Selected mutants are indicated by name (see Table S3 in the supplemental material for all mutants).
FIG 5
FIG 5
Intrinsic drug resistance of the ΔfecB mutant correlates with the antibiotic molecular mass. A correlation plot of the reduction in the MIC against the ΔfecB mutant relative to the MIC against the H37Rv WT strain versus antibiotic molecular mass is shown.
FIG 6
FIG 6
The ΔfecB mutant exhibits increased uptake of exogenous substrates. (A, B) Uptake of ethidium bromide by the WT (black), ΔfecB (red), and complemented (Comp; blue) strains in the absence (A) and presence (B) of 100 μg/ml verapamil. The fluorescent emission at 590 nm was measured at 1-min intervals from triplicate wells, and the data shown are representative of those from two independent experiments. (C) Uptake of Bodipy-FL-tagged vancomycin. A suspension of M. tuberculosis bacteria incubated with tagged vancomycin was sampled at the time points indicated. The emission at 538 nm normalized to the OD of the suspension was measured. The data points shown are means ± SDs from triplicate measurements and are representative of those from two independent experiments.

References

    1. World Health Organization. 2010. Guidelines for treatment of tuberculosis, 4th ed World Health Organization, Geneva, Switzerland: http://apps.who.int/iris/bitstream/10665/44165/1/9789241547833_eng.pdf.
    1. Dartois V. 2014. The path of anti-tuberculosis drugs: from blood to lesions to mycobacterial cells. Nat Rev Microbiol 12:159–167. doi:10.1038/nrmicro3200. - DOI - PMC - PubMed
    1. Jarlier V, Nikaido H. 1994. Mycobacterial cell wall: structure and role in natural resistance to antibiotics. FEMS Microbiol Lett 123:11–18. doi:10.1111/j.1574-6968.1994.tb07194.x. - DOI - PubMed
    1. Aldridge BB, Fortune SM. 2014. The spectrum of drug susceptibility in mycobacteria. Microbiol Spectr 2(5):MGM2-0031-2013. doi:10.1128/microbiolspec.MGM2-0031-2013. - DOI - PubMed
    1. da Silva PEA, Von Groll A, Martin A, Palomino JC. 2011. Efflux as a mechanism for drug resistance in Mycobacterium tuberculosis. FEMS Immunol Med Microbiol 63:1–9. doi:10.1111/j.1574-695X.2011.00831.x. - DOI - PubMed

MeSH terms

LinkOut - more resources