. 2017 Oct 2;216(10):3231-3247.
doi: 10.1083/jcb.201612106. Epub 2017 Sep 11.

Mitochondrial fission facilitates the selective mitophagy of protein aggregates

Affiliations

Mitochondrial fission facilitates the selective mitophagy of protein aggregates

Jonathon L Burman et al. J Cell Biol. .

Abstract

Within the mitochondrial matrix, protein aggregation activates the mitochondrial unfolded protein response and PINK1-Parkin-mediated mitophagy to mitigate proteotoxicity. We explore how autophagy eliminates protein aggregates from within mitochondria and the role of mitochondrial fission in mitophagy. We show that PINK1 recruits Parkin onto mitochondrial subdomains after actinonin-induced mitochondrial proteotoxicity and that PINK1 recruits Parkin proximal to focal misfolded aggregates of the mitochondrial-localized mutant ornithine transcarbamylase (ΔOTC). Parkin colocalizes on polarized mitochondria harboring misfolded proteins in foci with ubiquitin, optineurin, and LC3. Although inhibiting Drp1-mediated mitochondrial fission suppresses the segregation of mitochondrial subdomains containing ΔOTC, it does not decrease the rate of ΔOTC clearance. Instead, loss of Drp1 enhances the recruitment of Parkin to fused mitochondrial networks and the rate of mitophagy as well as decreases the selectivity for ΔOTC during mitophagy. These results are consistent with a new model that, instead of promoting mitophagy, fission protects healthy mitochondrial domains from elimination by unchecked PINK1-Parkin activity.


Figures

Figure 1.
Figure 1.
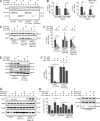
PINK1–Parkin regulate misfolded protein clearance from mitochondria. (A) Tet ON: WT OTC or ΔOTC-expressing HeLa cells with or without YFP-Parkin expression were treated with DOX for 48 h or for 48 h with a 24- or 48-h washout of DOX and then processed for Western blot analysis. (B) Quantification of Western blots described in A expressed as the percentage of OTC levels relative to OTC levels after 48 h DOX treatment normalized to Hsp90 levels. n ≥ 4. For left graphs, from left to right, *, P = 0.03; **, P = 0.008; ***, P = 0.0004; ***, P = 0.0001; for right graphs, ***, P = 5.8 × 10⁻⁵; ***, P = 0.0001; **, P = 0.007; **, P = 0.0011; ***, P = 6.7 × 10⁻⁹. Asterisks lacking a black underline represent significance values relative to OTC levels after 48 h DOX treatment (i.e., 100%). (C) Western blot of Tet ON: ΔOTC-expressing HeLa cells with YFP-Parkin expression with or without a PINK1 KO background and with or without PINK1-V5 expression were treated with DOX for 48 h or for 48 h with a 24 or 48 h washout of DOX. (D) Quantification of Western blots described in C and expressed as the percentage of ΔOTC levels relative to ΔOTC levels after 48 h DOX treatment normalized to Hsp90 levels. n ≥ 4. From left to right, ***, P = 2.4 × 10⁻⁶; ***, P = 3 × 10⁻⁸; *, P = 0.045; **, P = 0.006. (E) Western blot of Tet-ON: ΔOTC-expressing HeLa cells expressing YFP-Parkin with or without an ATG5 KO background treated with DOX for 48 h or with DOX for 48 h followed by a 24- or 48-h washout of DOX. (F) Quantification of Western blots described in E expressed as the percentage of ΔOTC levels relative to ΔOTC levels after 48 h DOX treatment normalized to Hsp90 levels. n = 3. From left to right, **, P = 0.003; ***, P = 0.0005; *, P = 0.03. (G) Tet-ON: ΔOTC-expressing HeLa cells without Parkin expression, with or without a PINK1 KO background, and with or without PINK1-V5 expression were treated with DOX for 48 h or for 48 h with a 48-h washout of DOX and with or without 100 nM bafilomycin and 20 µM QVD treatment and then processed for Western blot analysis. (H) Quantification of Western blots as described in G expressed as the percentage of ΔOTC levels relative to ΔOTC levels after 48 h DOX treatment normalized to Hsp90 levels. n ≥ 3. From left to right, ***, P = 9.93 × 10⁻⁵; **, P = 0.002; **, P = 0.008; *, P = 0.036; ***, P = 0.0005. (I) Western blot of HeLa cells stably expressing Tet-ON: WT OTC and ΔOTC in the same cell with YFP-Parkin expression after treatment with DOX for 48 h or 48 h with a 24-h washout of DOX with or without 200 nM bafilomycin treatment and 20 µM QVD after washout. Error bars indicate SD.
Figure 2.
Figure 2.
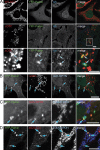
Parkin is recruited by PINK1 to focal sites on mitochondria that harbor matrix-localized misfolded protein aggregates. (A) Tet-ON: WT OTC or ΔOTC-expressing HeLa cells were treated with DOX for 48 h and then fixed and stained with antibodies against OTC (red) and Tom20 (green). Bars: (left) 10 µm; (right) 2 µm. (B) Tet-ON: WT OTC or ΔOTC-expressing HeLa cells expressing YFP-Parkin (green) were treated with DOX for 48 h and then fixed and stained for OTC (red) and TOM20 (blue). The blue arrows indicate YFP-Parkin foci that colocalized with ΔOTC. Bars: (top and middle) 10 µm; (bottom) 5 µm. (C) Tet-ON: WT OTC or ΔOTC-expressing cells expressing YFP-Parkin (green) were treated with DOX for 48 h, labeled with MitoTracker deep red (red), and imaged live. Blue arrows indicate YFP-Parkin foci that localized on polarized mitochondria. Bar, 5 µm. (D) Tet-ON: ΔOTC-expressing cells expressing YFP-Parkin (green) were treated with DOX for 48 h, labeled with MitoTracker deep red (red), and imaged live. Bar, 2 µm. (E) HeLa cells expressing YFP-Parkin (green) were treated with actinonin for 4 h, labeled with MitoTracker CMXRos (red), and imaged live. Bar, 5 µm. (F) Tet-ON: ΔOTC-expressing HeLa cells expressing YFP-Parkin with or without a PINK1 KO background were treated with DOX for 48 h, fixed, and imaged. Blue arrows indicate YFP-Parkin foci that localized on mitochondrial subdomains. Bar, 10 µm. (G) Quantification of the percentage of cells with Parkin recruitment in Tet-ON: ΔOTC-expressing HeLa cells with or without a PINK1 KO background after treatment with DOX for 48 h. n = 3; N ≥ 400. ***, P < 0.001. The error bar indicates SD. (H) HeLa cells stably expressing YFP-Parkin with or without a PINK1 KO background expressing mito-RFP (red) were treated with vehicle (DMSO) or 150 μM actinonin for 6 h, fixed, and imaged. Bar, 10 µm. (I) PINK1 KO Tet ON: ΔOTC-expressing HeLa cells expressing PINK1-V5-His (green) and mito-RFP (red) with and without DOX treatment for 72 h were processed for immunostaining. Uninfected PINK1 KO cells were stained as a negative control. Bar, 10 µm.
Figure 3.
Figure 3.
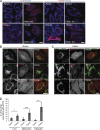
Autophagy machinery is recruited at focal sites on mitochondria containing misfolded protein aggregates. (A) Tet-ON: WT OTC or ΔOTC-expressing cells expressing YFP-Parkin (green) were treated with DOX for 48 h and processed for indirect immunofluorescence microscopy with antibodies against OTC (red) and ubiquitin (Ub; blue). (B) Tet ON: ΔOTC-expressing HeLa cells expressing YFP-Parkin (green) and mCherry-optineurin (mCh-OPTN; blue) were fixed and stained with an antibody against OTC (red). (C) Tet ON: ΔOTC-expressing HeLa cells expressing YFP-Parkin (green) and mCherry-optineurin (red) were fixed and stained with antibodies against TOM20 and PDH (blue). A superresolution Airyscan is depicted. (D) Tet ON: ΔOTC-expressing HeLa cells also expressing YFP-Parkin (green) and mCherry-LC3 (red) were fixed and stained with antibodies to TOM20 and PDH (blue). For A–D, blue arrows denote Parkin foci that colocalized with ΔOTC, optineurin, ubiquitin, or LC3 on mitochondria, respectively. Bars: (A, top, and B–D) 10 µm; (A, bottom) 5 µm.
Figure 4.
Figure 4.
Autophagy factors colocalize with ΔOTC foci in a PINK1-dependent manner. (A) Tet ON: ΔOTC-expressing HeLa cells with or without a PINK1 KO background and with or without YFP-Parkin expression expressing mCherry-LC3 (LC3; red) or mCherry-optineurin (OPTN; red) were treated with DOX for 48 h, fixed, stained for TOM20 (blue), and imaged. (B) Tet-ON: ΔOTC-expressing cells with YFP-Parkin expression with or without mCherry-LC3 or mCherry-optineurin (red) expression were treated with DOX for 48 h and processed for indirect immunofluorescence microscopy with an antibody against OTC (green) and ubiquitin (Ub; red).Bar, 10 µm. (C) Tet-ON: ΔOTC-expressing cells without YFP-Parkin expression with or without mCherry-LC3 or mCherry-optineurin (red) expression were treated with DOX for 48 h and processed for indirect immunofluorescence microscopy with an antibody against OTC (green) and ubiquitin (red). Bars, 10 µm. (D) Quantification of the percentage of foci of LC3, optineurin, or ubiquitin that colocalize with ΔOTC in the cells with and without Parkin expression as described in B and C. *, P < 0.05; **, P < 0.01; ***, P < 0.001. Error bars indicate SD.
Figure 5.
Figure 5.
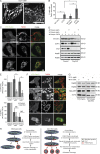
Proteotoxic stress induces mitochondrial fission in a PINK1-dependent manner. (A) Tet ON: ΔOTC-expressing HeLa cells expressing YFP-Parkin (green) were treated with DOX for 48 h, stained for TOM20 (red), and imaged. Boxes mark cropped images shown below. (B) Tet ON: WT OTC or ΔOTC-expressing HeLa cells expressing YFP-Parkin (green) were treated with DOX for 72 h, stained for OTC (red) and TOM20 (blue), and imaged. (C) Tet ON: ΔOTC-expressing HeLa cells expressing YFP-Parkin (green) with or without treatment with DOX for 48 h and with or without a PINK1 KO background were stained for TOM20 (red) and imaged. Bars: (A, top, and B and C) 10 µm; (A, bottom) 5 µm. (D) Quantification of the percentage of cells with fragmented mitochondria that also do or do not display focal Parkin recruitment in the cells described in C. **, P < 0.01; ***, P < 0.001. Error bars indicate SD.
Figure 6.
Figure 6.
Drp1 is required for fission of subdomains harboring ΔOTC but not ΔOTC clearance. (A) Tet ON: ΔOTC-expressing HeLa cells expressing YFP-Parkin (green) and mito-RFP (red) were imaged live over the indicated time points. Yellow arrows mark a Parkin focus that fragmented and trafficked away from a mitochondrion. (B) Tet-ON: ΔOTC-expressing HeLa cells expressing YFP-Parkin (green), mito-RFP (red), and Drp1K38A were imaged live over the indicated time points. Yellow arrows denote the location of immobile Parkin foci on the intact mitochondrial network. Bars, 10 µm. (C) Quantification of the percentage of cells with mobile Parkin foci that underwent fission events from mitochondrial subdomains in Tet-ON: ΔOTC-expressing HeLa cells expressing YFP-Parkin with or without Drp1 inhibition after 48 h DOX treatment. For control and Drp1 KO, n ≥ 3; n ≥ 20. For Drp1 K38A, n = 2; n ≥ 10. (D) Tet-ON: ΔOTC-expressing HeLa cells with or without a Drp1 KO background expressing YFP-Parkin were treated with DOX for 48 h or 48 h with a 24-h washout of DOX with or without treatment with 200 nM bafilomycin and 20 µM QVD and then processed for Western blot analysis. (E) Quantification of Western blots as described in D and expressed as the percentage of ΔOTC levels after 48 h DOX treatment after normalization to Hsp90 levels. n = 4. *, P < 0.05; **, P < 0.01; ***, P < 0.001. Error bars indicate SD.
Figure 7.
Figure 7.
Drp1 is recruited to Parkin foci and triggers fission of mitochondrial subdomains coated in Parkin. (A) Tet-ON: ΔOTC-expressing HeLa cells expressing YFP-Parkin (green) with or without a Drp1 KO background were treated with DOX for 48 h or for 48 h with a 24- or 48-h washout of DOX. Cells were fixed and stained for TOM20 (blue) and ΔOTC (red). (B) Tet-ON: ΔOTC-expressing HeLa cells expressing YFP-Parkin (green) with or without a Drp1 KO background with or without DOX treatment were fixed for 48 h and stained for Drp1 (red) and TOM20 (blue). Bars: (A and B, top) 10 µm; (B, bottom) 5 µm. (C) Quantification of the percentage of cells described in A with Parkin foci recruitment to mitochondria. n = 3. **, P < 0.01. Error bars indicate SD.
Figure 8.
Figure 8.
Drp1 functions to prevent wholesale mitophagy by restricting PINK1–Parkin activity to mitochondrial subdomains. (A) Tet ON: WT OTC or ΔOTC-expressing HeLa cells expressing Drp1 K38A were treated with DOX for 48 h and then processed for indirect immunofluorescence with an antibody to OTC. (B) Quantification of the percentage of cells with Parkin recruitment in control and Drp1 K38A expressing Tet ON: WT OTC or ΔOTC HeLa cells that also express YFP-Parkin. n = 2; n ≥ 50. (C) Tet-ON: ΔOTC-expressing cells expressing YFP-Parkin (green) with or without a Drp1 KO background with or without treatment with DOX for 48 h were labeled with TMRM (red) and imaged live. (D) HeLa cells expressing Tet ON: WT OTC and ΔOTC in the same cell expressing YFP-Parkin with or without a Drp1 KO background were treated with DOX for 48 h or 48 h with a 24- or 48-h washout of DOX and then processed for Western blot analysis. (E) Quantification of Western blots as described in D expressed as the percentage of OTC levels relative to OTC levels after 48 h DOX treatment normalized to Hsp90 levels. n = 3. *, P < 0.05; **, P < 0.01. Error bars indicate SD. (F) WT HCT116 or HeLa cells expressing YFP-Parkin (green) with or without a Drp1 KO background were labeled with TMRM (red) and imaged live. Bars, 10 µm. (G) Tet ON: ΔOTC-expressing cells also expressing YFP-Parkin with or without a Drp1 KO background were infected with Cell Light mito-GFP virus overnight and then treated with DOX for 48 h or 48 h with a 24-h washout of DOX and processed for Western blot analysis. (H) Model depicting the role of PINK, Parkin, and Drp1 in the selective mitophagy of protein aggregates from mitochondria.
Figure 9.
Figure 9.
Autophagy receptors are recruited to intact mitochondria in Drp1 KO cells, enhancing mitophagic flux. (A and B) FACS-based mito-Keima assay dot plots of Tet ON: ΔOTC-expressing HeLa cells expressing YFP-Parkin with or without DOX treatment (A) or OA treatment (B) for the indicated time points with or without a Drp1 KO background. The y axis represents the fluorescence emission of mito-Keima at pH 4.0 (lysosome) versus the x axis, which indicates mito-Keima emission at pH 7.0 (mitochondria). The percentage of cells within the boxed regions are indicated. (C) Tet ON: ΔOTC-expressing Drp1 KO HeLa cells expressing YFP-Parkin (green), mCherry-optineurin, mCherry-LC3, or mito-RFP (red) were treated with DOX for 48 h and then processed for indirect immunofluorescence with an antibody to TOM20, PDH, ubiquitin (blue), or p62 (red). Each row represents a different cell. (D and E) Control or Drp1 KO HeLa cells were treated with actinonin for 6 h, fixed, and stained with an antibody to TOM20 (red) and ubiquitin (D) or p62 (blue; E). (F) Drp1 KO HeLa cells expressing YFP-Parkin (green) and mito-RFP (red) were treated with actinonin for 6 h and imaged live for the indicated times. Bars, 10 µm.
Figure 10.
Figure 10.
MDVs are not essential for misfolded protein clearance from mitochondria. (A) Tet ON: ΔOTC-expressing HeLa cells also expressing YFP-Parkin with or without a Drp1 KO background were treated with 20 nM control, syntaxin 17, or pink1 RNAi for 24 h and then treated with DOX for 48 h or 48 h with a 24-h washout of DOX, and cells were processed for Western blot. (B) Quantification of Western blots as described in A expressed as the percentage of ΔOTC levels relative to ΔOTC levels after 48 h DOX treatment normalized to Hsp90 levels. n ≥ 3. (C) HeLa cells expressing YFP-Parkin with or without a Drp1 KO background and with or without a syntaxin 17 KO background were processed for Western blot analysis. The asterisk indicates a nonspecific band. (D) HeLa cells expressing YFP-Parkin with a Drp1 KO background and with or without a syntaxin 17 KO background were treated with actinonin for 16 h with and without 400 nM bafilomycin treatment and then were processed for Western blot analysis. (E) Quantification of Western blots as described in D expressed as the percentage of control TIM23 or Hsp60 levels normalized to Hsp90 levels. n ≥ 3. *, P < 0.05; **, P < 0.01; ***, P < 0.001. Error bars indicate SD.

Comment in

  • Splitting up for mitophagy.
    Kary C. Kary C. Nat Cell Biol. 2018 Mar;20(3):224. doi: 10.1038/s41556-018-0058-7. Nat Cell Biol. 2018. PMID: 29476156 No abstract available.

References

    1. Abeliovich H., Zarei M., Rigbolt K.T., Youle R.J., and Dengjel J.. 2013. Involvement of mitochondrial dynamics in the segregation of mitochondrial matrix proteins during stationary phase mitophagy. Nat. Commun. 4:2789 10.1038/ncomms3789 - DOI - PMC - PubMed
    1. Burman J.L., Yu S., Poole A.C., Decal R.B., and Pallanck L.. 2012. Analysis of neural subtypes reveals selective mitochondrial dysfunction in dopaminergic neurons from parkin mutants. Proc. Natl. Acad. Sci. USA. 109:10438–10443. 10.1073/pnas.1120688109 - DOI - PMC - PubMed
    1. Deng H., Dodson M.W., Huang H., and Guo M.. 2008. The Parkinson’s disease genes pink1 and parkin promote mitochondrial fission and/or inhibit fusion in Drosophila. Proc. Natl. Acad. Sci. USA. 105:14503–14508. 10.1073/pnas.0803998105 - DOI - PMC - PubMed
    1. Denison S.R., Wang F., Becker N.A., Schüle B., Kock N., Phillips L.A., Klein C., and Smith D.I.. 2003. Alterations in the common fragile site gene Parkin in ovarian and other cancers. Oncogene. 22:8370–8378. 10.1038/sj.onc.1207072 - DOI - PubMed
    1. Friedman J.R., and Nunnari J.. 2014. Mitochondrial form and function. Nature. 505:335–343. 10.1038/nature12985 - DOI - PMC - PubMed

MeSH terms