. 2017 Nov 6;7(11):3605-3620.
doi: 10.1534/g3.117.300259.

Comparison of Single Genome and Allele Frequency Data Reveals Discordant Demographic Histories

Affiliations

Comparison of Single Genome and Allele Frequency Data Reveals Discordant Demographic Histories

Annabel C Beichman et al. G3 (Bethesda). .

Abstract

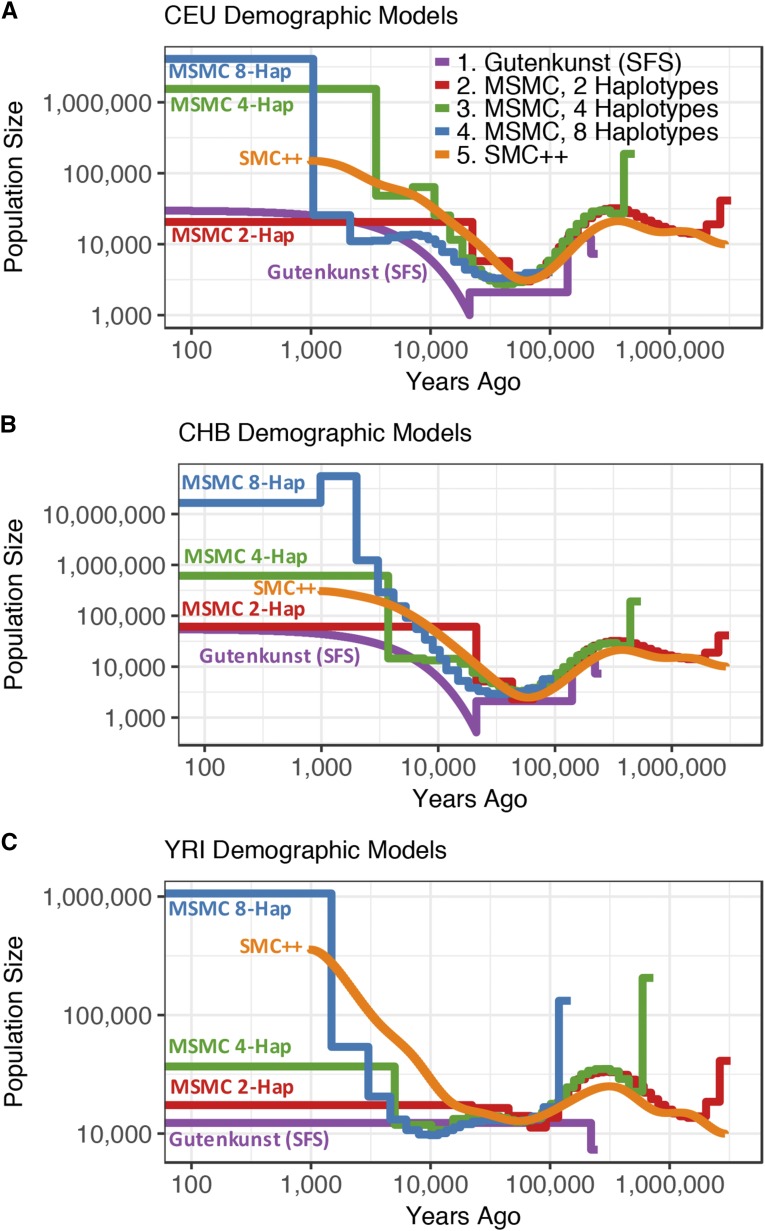
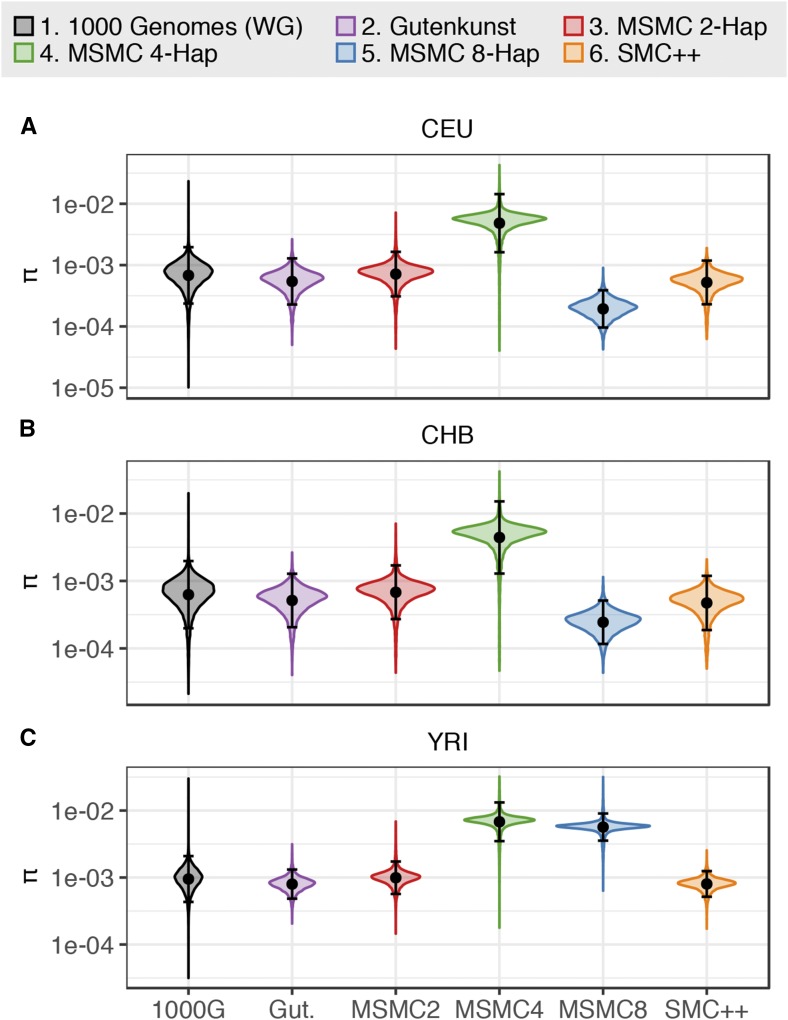
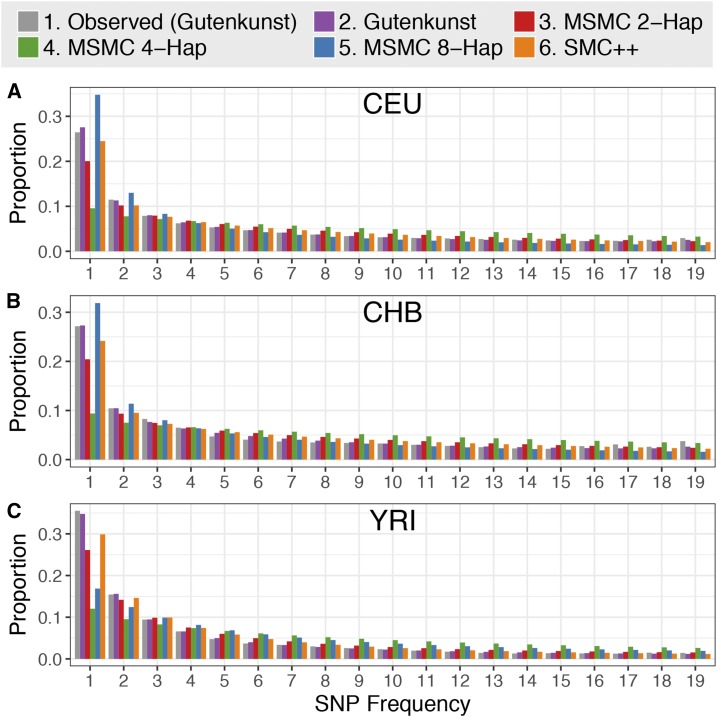
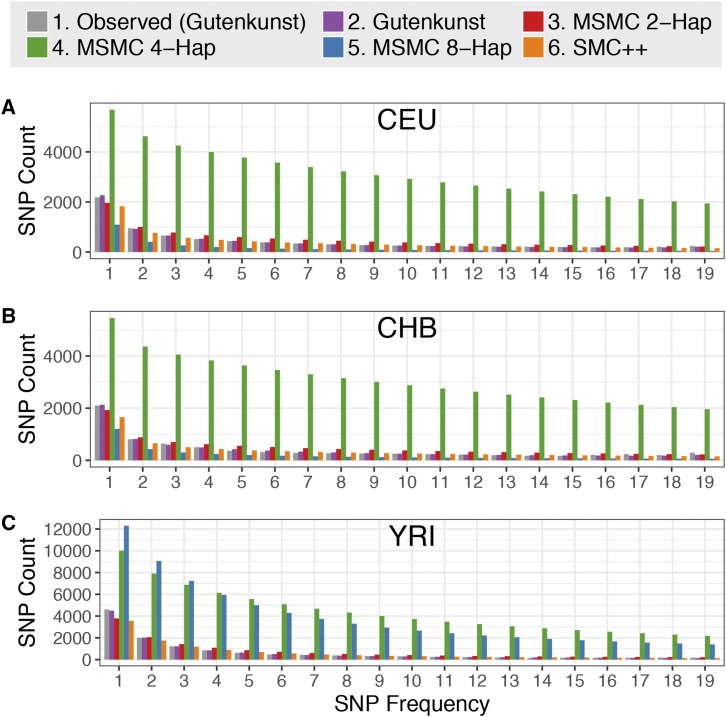
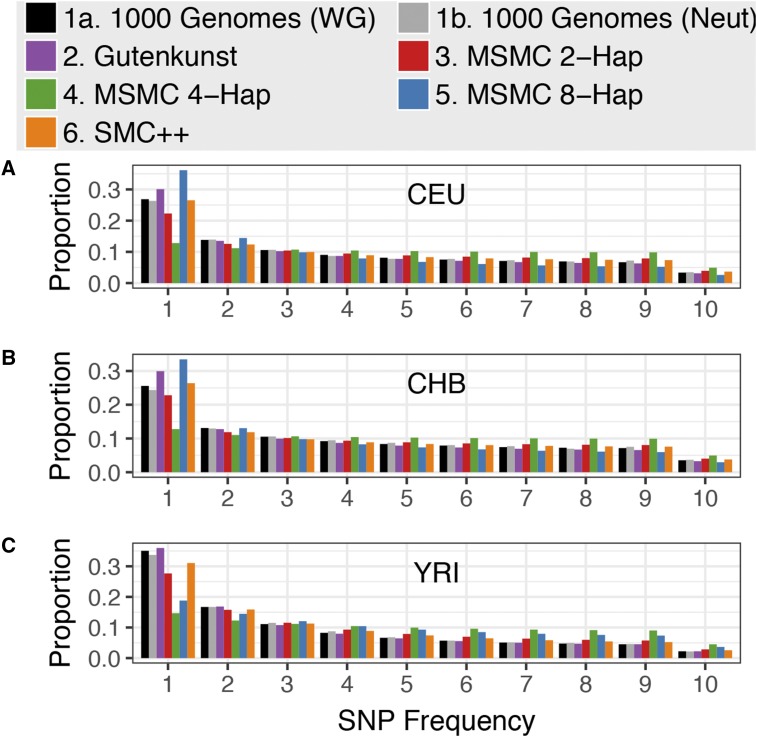
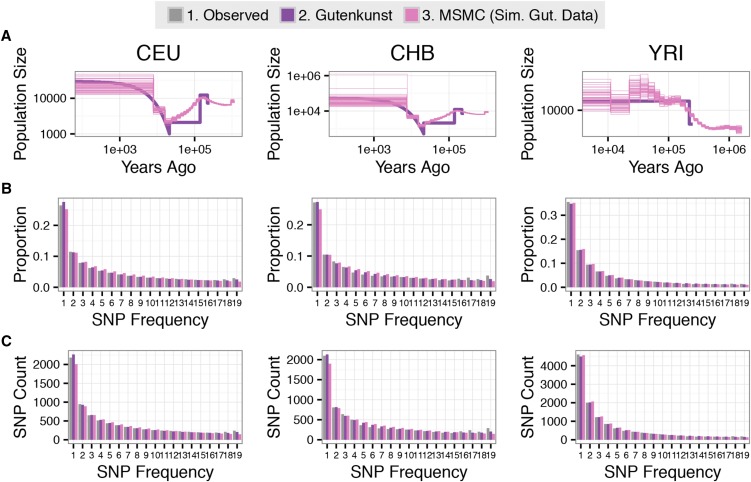
Inference of demographic history from genetic data is a primary goal of population genetics of model and nonmodel organisms. Whole genome-based approaches such as the pairwise/multiple sequentially Markovian coalescent methods use genomic data from one to four individuals to infer the demographic history of an entire population, while site frequency spectrum (SFS)-based methods use the distribution of allele frequencies in a sample to reconstruct the same historical events. Although both methods are extensively used in empirical studies and perform well on data simulated under simple models, there have been only limited comparisons of them in more complex and realistic settings. Here we use published demographic models based on data from three human populations (Yoruba, descendants of northwest-Europeans, and Han Chinese) as an empirical test case to study the behavior of both inference procedures. We find that several of the demographic histories inferred by the whole genome-based methods do not predict the genome-wide distribution of heterozygosity, nor do they predict the empirical SFS. However, using simulated data, we also find that the whole genome methods can reconstruct the complex demographic models inferred by SFS-based methods, suggesting that the discordant patterns of genetic variation are not attributable to a lack of statistical power, but may reflect unmodeled complexities in the underlying demography. More generally, our findings indicate that demographic inference from a small number of genomes, routine in genomic studies of nonmodel organisms, should be interpreted cautiously, as these models cannot recapitulate other summaries of the data.

Keywords: demographic inference; nonmodel organisms; pairwise sequentially Markovian coalescent; population genetics; site frequency spectrum.


Figures

Figure 1
Figure 1
Demographic histories for the (A) CEU, (B) CHB, and (C) YRI populations. Trajectories are log scaled and in terms of physical units (diploid individuals and years). Models were either inferred using SFS-based methods (Gutenkunst) by Gutenkunst et al. (2009); from a sequentially Markovian coalescent-based approach (MSMC) from two, four, and eight haplotypes by Schiffels and Durbin (2014); or using a combined SFS and whole genome approach (SMC++) by Terhorst et al. (2017). The Gutenkunst models also include migration between all three populations, not depicted here. Models are scaled by the generation times used in each study [Gutenkunst et al. (2009): 25 yr/generation; Schiffels and Durbin (2014): 30 yr/generation; Terhorst et al. (2017): 29 yr/generation].
Figure 2
Figure 2
Kernel density distribution of expected heterozygosity (π per site). Heterozygosity was calculated across 100-kb windows from whole genome 1000 Genomes Project data for (A) CEU, (B) CHB, and (C) YRI, and from 20,000 × 100-kb blocks for data simulated under each demographic model. The black dot and bars indicate the mean ± 2 SD for each distribution. Note the log-10 scaling on the y-axis.
Figure 3
Figure 3
LD decay patterns. LD decay was calculated across 100-kb windows from 1000 Genomes data and simulated data under each demographic model for (A) CEU, (B) CHB, and (C) YRI. Pairs of SNPs are binned based on physical distance (bp) between them, up to 51 kb. Average genotype r2 is calculated within each distance bin.
Figure 4
Figure 4
Unfolded proportional site frequency spectra for (A) CEU, (B) CHB (B), and (C) YRI populations. The “observed” SFS is from noncoding sequence used by Gutenkunst et al. (2009) to infer demographic histories for these three populations. See Figure S5 in File S1 for scaling using alternative mutation rates.
Figure 5
Figure 5
SNP count SFSs using the counts of SNPs for the (A) CEU, (B) CHB, and (C) YRI populations. The “observed” SFS is from noncoding sequence used by Gutenkunst et al. (2009) to infer demographic histories for these three populations. SFSs are scaled using the ancestral population size given by each model, the mutation rate used to scale each model by the authors, and the sequence length of the empirical data set (4.04 Mb). See Figure S6 in File S1 for scaling using alternative mutation rates.
Figure 6
Figure 6
Folded proportional SFSs for (A) CEU, (B) CHB, and (C) YRI populations. The “1000 Genomes (WG)” SFS is from low-coverage whole genome 1000 Genomes data, and the “1000 Genomes (Neut)” SFS is from 6333 × 10-kb putatively neutral regions in the 1000 Genomes data.
Figure 7
Figure 7
MSMC 2-haplotype can accurately infer the demographic model predicted by Gutenkunst et al. (2009). (A) The results of running MSMC 2-haplotype on 50 independent two-haplotype data sets simulated under the Gutenkunst et al. (2009) model of human demographic history (Gutenkunst, heavy purple line). The resulting MSMC 2-haplotype trajectories (“MSMC Sim. Gut. Data,” fine pink lines) show the MSMC trajectories inferred from these 50 data sets. Note that these trajectories accurately track the demographic model used to simulate the data. (B) and (C) show proportional and SNP count SFSs for each population, respectively. The gray bars (observed) denote the empirical SFS used by Gutenkunst et al. (2009). The purple bars denote the expected SFS under the inferred Gutenkunst demographic models. The pink bars denote the expected SFS under the average of the 50 MSMC 2-haplotype demographic model trajectories for each population. Note that these three SFSs agree.

References

    1. 1000 Genomes Project Consortium , 2015. A global reference for human genetic variation. Nature 526: 68–74. - PMC - PubMed
    1. Adams A. M., Hudson R. R., 2004. Maximum-likelihood estimation of demographic parameters using the frequency spectrum of unlinked single-nucleotide polymorphisms. Genetics 168: 1699–1712. - PMC - PubMed
    1. Albert V. A., Barbazuk W. B., Der J. P., Leebens-Mack J., Ma H., et al. , 2013. The Amborella genome and the evolution of flowering plants. Science 342: 1241089. - PubMed
    1. Arbiza L., Zhong E., Keinan A., 2012. NRE: a tool for exploring neutral loci in the human genome. BMC Bioinformatics 13: 301. - PMC - PubMed
    1. Ardlie K., Liu-Cordero S. N., Eberle M. A., Daly M., Barrett J., et al. , 2001. Lower-than-expected linkage disequilibrium between tightly linked markers in humans suggests a role for gene conversion. Am. J. Hum. Genet. 69: 582–589. - PMC - PubMed

LinkOut - more resources