. 2017 Oct 1;144(19):3440-3453.
doi: 10.1242/dev.154971. Epub 2017 Sep 11.

Epithelial-mesenchymal transition transcription factors control pluripotent adult stem cell migration in vivo in planarians

Affiliations

Epithelial-mesenchymal transition transcription factors control pluripotent adult stem cell migration in vivo in planarians

Prasad Abnave et al. Development. .

Abstract

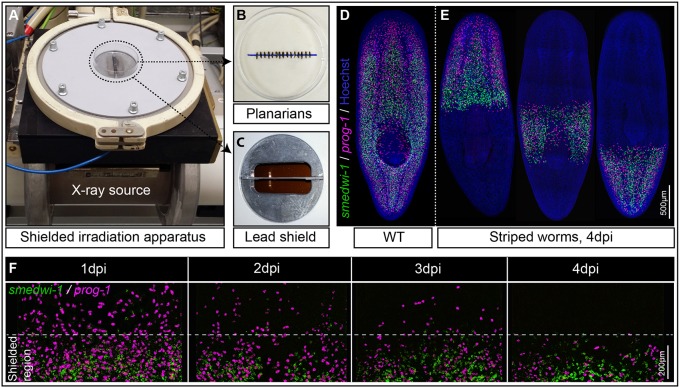
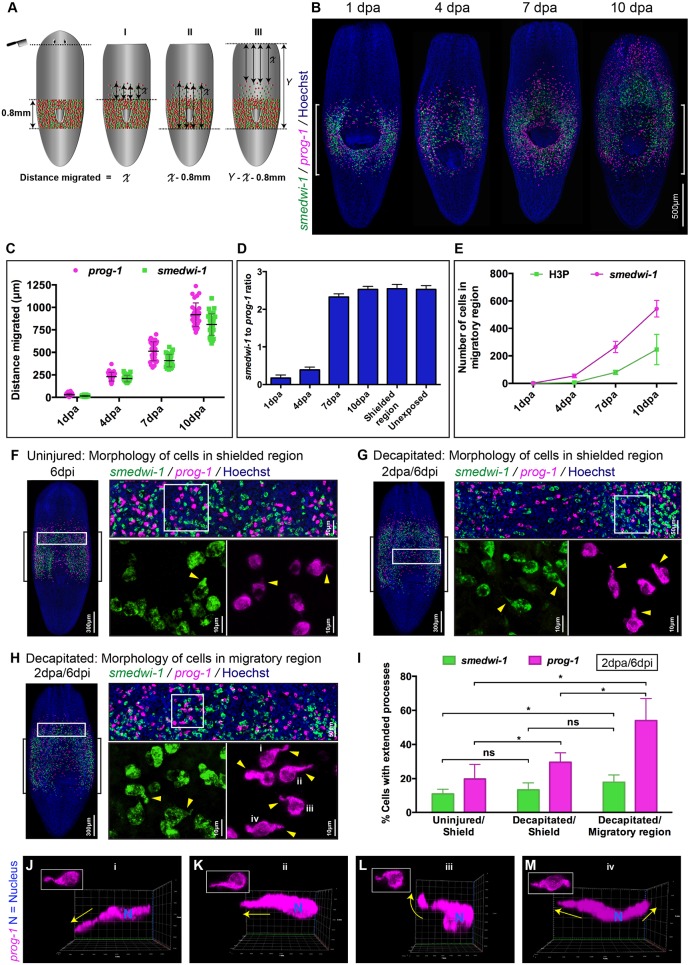
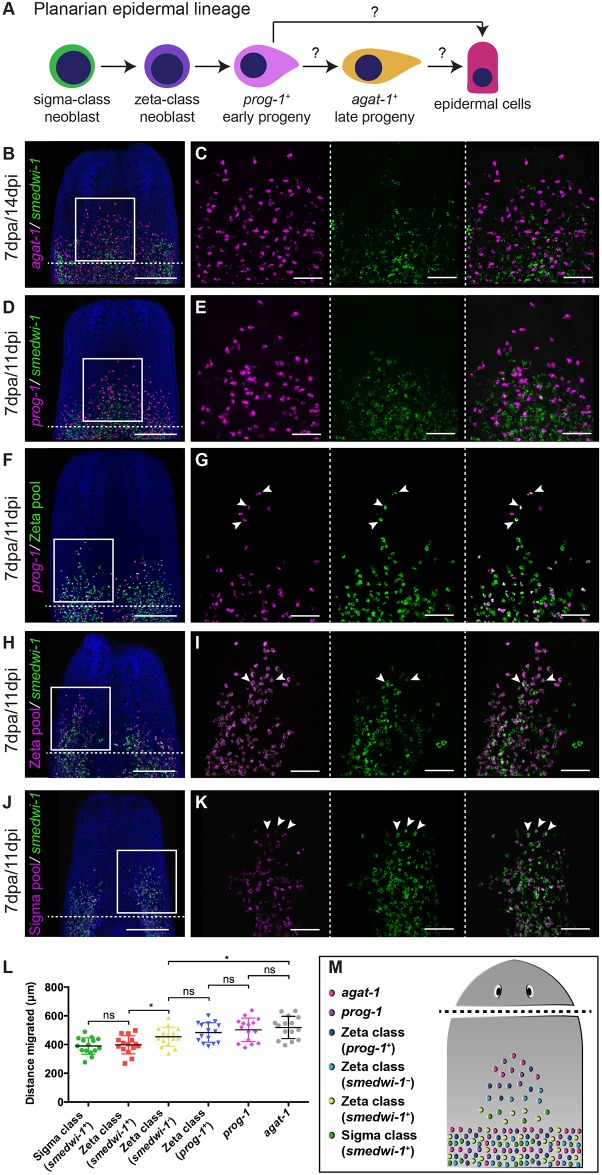
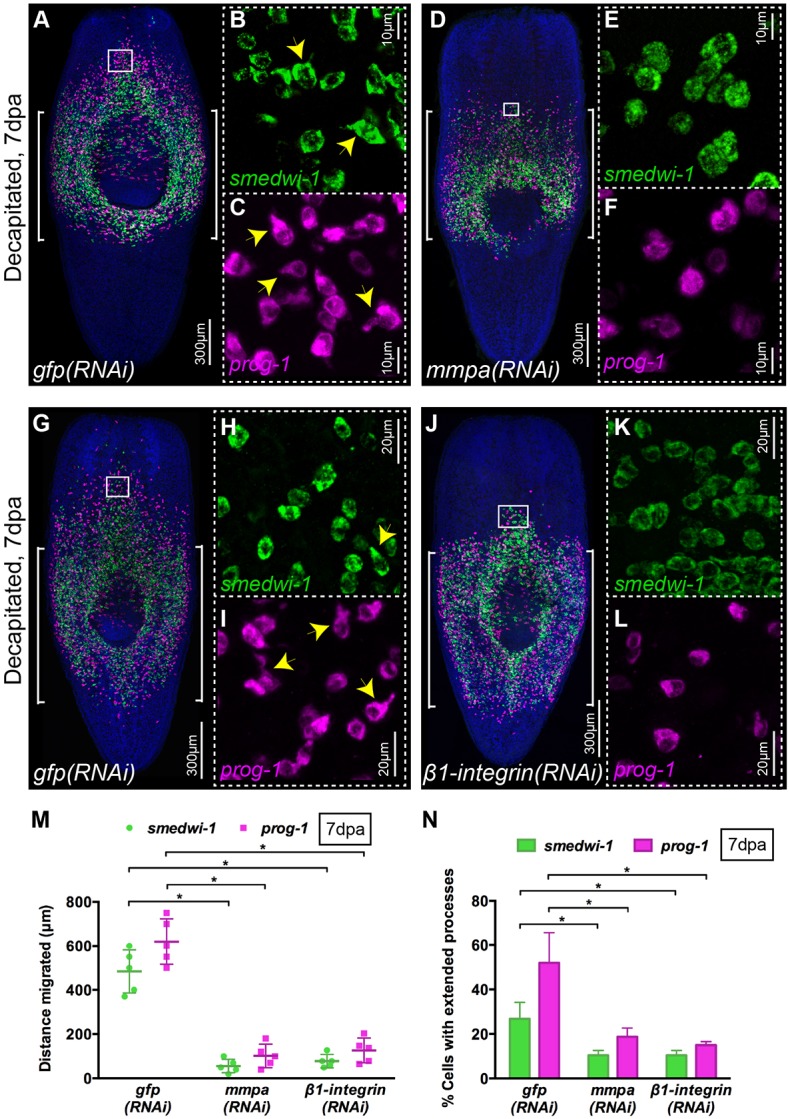
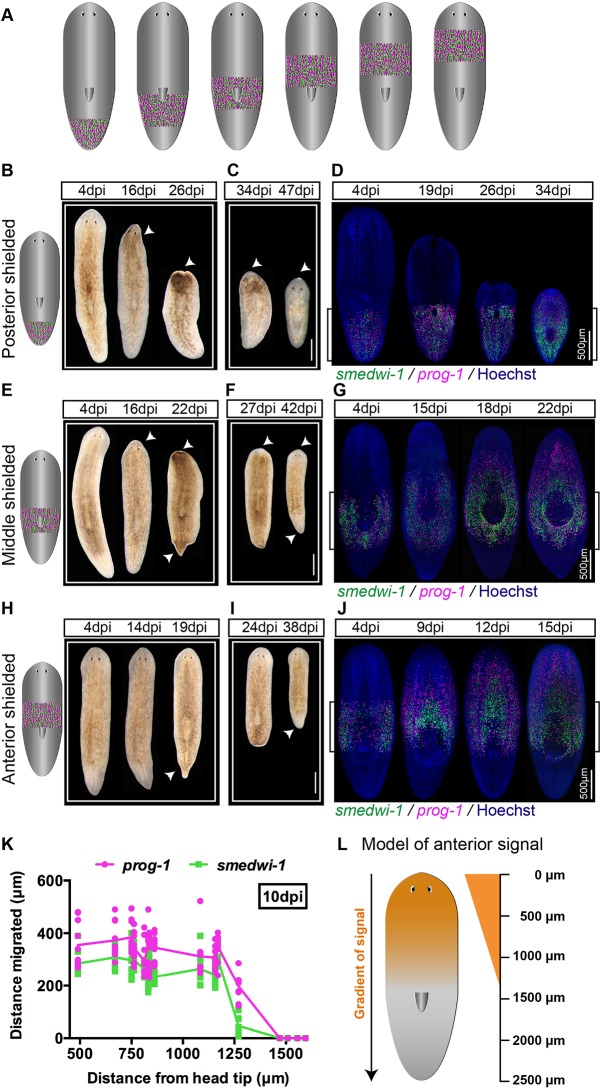
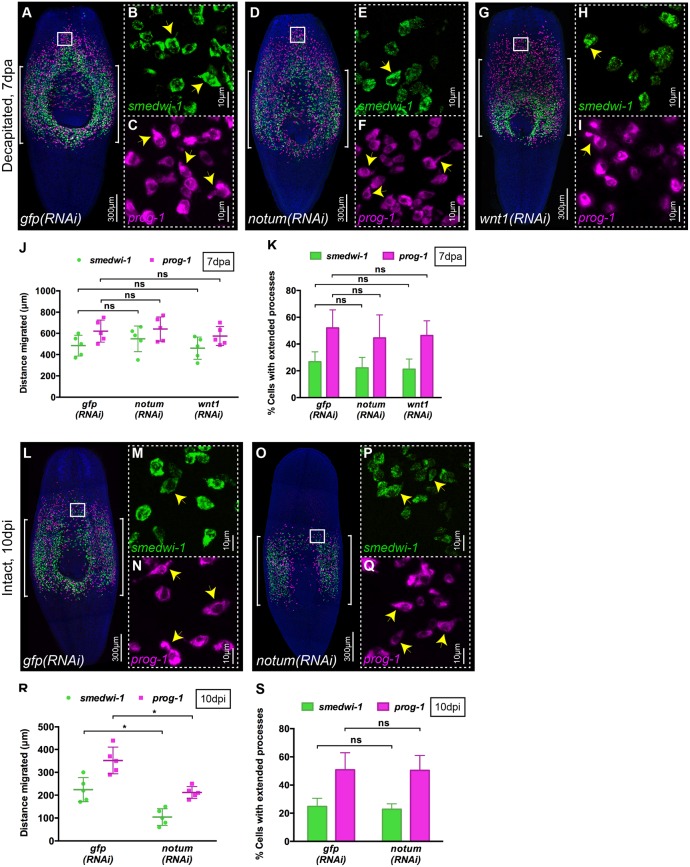
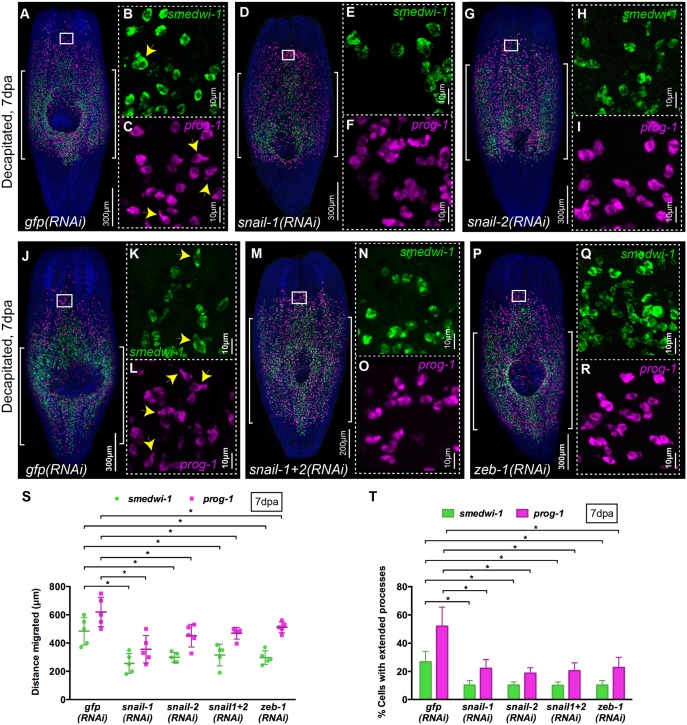
Migration of stem cells underpins the physiology of metazoan animals. For tissues to be maintained, stem cells and their progeny must migrate and differentiate in the correct positions. This need is even more acute after tissue damage by wounding or pathogenic infection. Inappropriate migration also underpins metastasis. Despite this, few mechanistic studies address stem cell migration during repair or homeostasis in adult tissues. Here, we present a shielded X-ray irradiation assay that allows us to follow stem cell migration in planarians. We demonstrate the use of this system to study the molecular control of stem cell migration and show that snail-1, snail-2 and zeb-1 EMT transcription factor homologs are necessary for cell migration to wound sites and for the establishment of migratory cell morphology. We also observed that stem cells undergo homeostatic migration to anterior regions that lack local stem cells, in the absence of injury, maintaining tissue homeostasis. This requires the polarity determinant notum Our work establishes planarians as a suitable model for further in-depth study of the processes controlling stem cell migration in vivo.

Keywords: EMT; Migration; Planarian; Pluripotency; Schmidtea mediterranea; Snail; Wounding.


Conflict of interest statement

Competing interestsThe authors declare no competing or financial interests.

Figures

Fig. 1.
Fig. 1.
The shielded irradiation assay. (A-C) Point source X-ray irradiator (A) passing through a lead shield (C) with aligned Schmidtea mediterranea worms (B) that have been anesthetized in 0.2% chloretone. (D) Wild-type (WT) unirradiated planarians showing distribution of NBs (green) and their early progeny (magenta). (E) Striped planarians at 4 days post irradiation (dpi) showing bands of stem cells (green) and early progeny (magenta) restricted to the irradiation-protected region. (F) Loss of NBs (green) and early progeny (magenta) in the non-shielded region after 1, 2, 3 or 4 dpi (n=10), and maintenance within the shielded region. See also Fig. S1.
Fig. 2.
Fig. 2.
Wound-induced cell migration and characteristic extended morphology of migrating stem cells and stem cell progeny. (A) Model demonstrating the position of the wound and three (I, II and III) independent methods for measuring migration distances. (B) Representative WFISH showing NBs (green) and progeny (magenta). Brackets indicate the shielded area. (C) Distances migrated during migration and repopulation of NBs (green) and early progeny (magenta) after shielding across the pharynx at 1, 4, 7 and 10 days post injury (dpa). Each dot represents the average distance migrated by the ten most distal cells in each animal (n=20 per time point). (D) NB to early progeny ratio in the migratory region at 1, 4, 7 and 10 dpa (decapitation) (n=20 per time point). Ratio of cells in the shielded region and in unexposed worms is used as a control. Mean±s.d. (E) Quantification of NBs (magenta) and mitotic cells (green) in the migratory region following decapitation at 1, 4, 7 or 10 days (n=20 per time point). Mean±s.d. H3P, H3ser10p. (F-H) Morphology of cells within the shielded region in an uninjured worm (F), within the shielded region in a decapitated worm (G) and within the migratory region in the decapitated worm (H) shows NBs (green) and early progeny cells (magenta) with and without extended cytoplasmic projections (n=20 in each condition). Brackets indicate the shielded area. Arrowheads indicate examples of extended processes. (I) Quantification of cells with processes shows an increase in the number of NBs (green) and early progeny (magenta) with extended processes within the decapitated/migratory region as well as the decapitated/shielded region compared with the uninjured/shielded region (n=20 per condition). Mean±s.d. Student's t-test, *P<0.05; ns, not significant. (J-M) Early progeny cells (magenta) within the migratory region in decapitated worms (i-iv in H, boxed) show extended processes in various directions relative to the wound. Arrows indicate the direction of extended processes. Relative position of wound to cells is to the top. J-M and i-iv are the same cells: i-iv, top views; J-M, side views. See also Fig. S2.
Fig. 3.
Fig. 3.
Epidermal lineage cell migration. (A) Current model of planarian epidermal lineage differentiation. Question marks indicate that currently there is no direct evidence demonstrating direct transitions from one cell type to another. (B-K) WFISH showing migration of the epidermal lineage at 7 dpa. (B,C) agat-1+ cells (magenta) and smedwi-1+ cells (green). (D,E) prog-1+ cells (magenta) and smedwi-1+ cells. (F,G) prog-1+ cells (magenta), zeta class cells (green) and prog-1+/zeta class double-positive cells (white). (H,I) smedwi-1 zeta class cells (magenta) and smedwi-1+ zeta stem cells (white) and smedwi-1+ cells (green). (J,K) smedwi-1+ sigma stem cells (white) and smedwi-1+ cells (green) migrate. Arrowheads indicate examples of double-positive cells. The shielded region is beneath the dotted line. Scale bars: 300 μm in B,D,F,H,J; 100 μm for C,E,G,I,K. (L) Distance traveled by the ten most distal cells in each population (smedwi-1+ sigma class stem cells, smedwi-1+ zeta class stem cells, smedwi-1 zeta class cells, prog-1+/zeta class double-positive cells, prog-1+ cells and agat-1+ cells) in decapitated worms at 7 dpa. n=15 per condition. Student's t-test, *P<0.05. (M) Summary of migration and differentiation data after wounding.
Fig. 4.
Fig. 4.
mmpa and β1-integrin are essential for migration and cell extension formation. (A-L) WFISH shows migration of NBs (green) and early progeny (magenta) at 7 dpa in control gfp(RNAi) (A-C,G-I) and lack of migration in mmpa(RNAi) (D-F) and β1-integrin(RNAi) (J-L) animals. Insets show the presence of NBs and early progeny with extended cytoplasmic projections in the migratory region of gfp(RNAi) worms (B,C,H,I, arrowheads) that are almost absent in mmpa(RNAi) (E,F) and β1-integrin(RNAi) (K,L) worms (n=5). Brackets indicate the shielded area. (M) Distance migrated by NBs (green) and early progeny (magenta) at 7 dpa in mmpa(RNAi) and β1-integrin(RNAi) animals compared with control gfp(RNAi) worms (n=5). Each dot represents the average distance migrated by the ten most distal cells from each animal. Mean±s.d. Student's t-test, *P<0.05. (N) Quantification of NBs (green) and early progeny (magenta) with extended processes in mmpa(RNAi), β1-integrin(RNAi) and control gfp(RNAi) animals at 7 dpa (n=5). Mean±s.d. Student's t-test, *P<0.05. See also Fig. S3.
Fig. 5.
Fig. 5.
NBs and their progeny migrate anteriorly in the absence of injury. (A) Strategy of shielding worms at various places along the AP axis. (B,C,E,F,H,I) Bright-field images of worms shielded at three different places, namely posterior (B,C), middle (E,F) and anterior (H,I), showing regression and recovery over time (n=20 per time point). Arrowheads indicate regressed (B,E,H) and regenerated (C,F,I) regions. Scale bars: 500 μm. (D,G,J) WFISH showing no migration of NBs (green) and early progeny (magenta) in posteriorly shielded worms until the anterior tissue regresses close enough to the shielded region (D). By contrast, NBs and early progeny migrate after failure in anterior tissue integrity in middle shielded worms (G). In anteriorly shielded worms, cells migrate without a visible loss of anterior integrity (J). n=20 per time point. Brackets indicate the shielded area. (K) Distance migrated by NBs (green) and early progeny (magenta) in worms shielded at different places along the AP axis in the absence of anterior wound. Each dot represents the average distance migrated by the ten most distal cells in each animal (n=6). (L) Model showing a gradient of signal (orange) from head tip to up to ∼1.3 mm towards posterior in ∼2.5 mm-long worms.
Fig. 6.
Fig. 6.
notum is required for migration in the absence of wounding. (A-I) WFISH showing migration of NBs (green) and early progeny (magenta) at 7 dpa in (A-C) control gfp(RNAi), (D-F) notum(RNAi) and (G-I) wnt1(RNAi) animals. Brackets indicate the shielded area. Insets show that NBs and early progeny in the migratory region from (B,C) gfp(RNAi), (E,F) notum(RNAi) and (H,I) wnt1(RNAi) animals are able to form extended processes (arrowheads). (J) Distances migrated by NBs (green) and early progeny (magenta) at 7 dpa in gfp(RNAi), notum(RNAi) and wnt1(RNAi) animals are equal (n=5). Each dot represents the average distance migrated by the ten most distal cells from each animal. Mean±s.d. Student's t-test. (K) Number of NBs and early progeny with extended processes in notum(RNAi), wnt1(RNAi) and gfp(RNAi) animals (n=5). Mean±s.d. Student's t-test. (L-Q) WFISH showing migration of NBs (green) and early progeny (magenta) at 10 dpi in intact (O-Q) notum(RNAi) animals compared with intact (L-N) gfp(RNAi) animals. Brackets indicate the shielded area. (M,N,P,Q) The morphology of NBs and early progeny in the migratory region. Arrowheads indicate examples of cells with extended processes. (R) Distance migrated by NBs (green) and early progeny (magenta) at 10 dpi in notum(RNAi) animals compared with gfp(RNAi) animals (n=5). Each dot represents the average distance migrated by the ten most distal cells from each animal. Mean±s.d. Student's t-test, *P<0.05. (S) Quantification of extended processes of NBs and early progeny in notum(RNAi) compared with gfp(RNAi) animals (n=5). Mean±s.d. Student's t-test. See also Fig. S4.
Fig. 7.
Fig. 7.
Snail family genes control migration of stem cells and their progeny. (A-R) WFISH shows migration of NBs (green) and early progeny (magenta) at 7 dpa in (A-C,J-L) gfp(RNAi), (D-F) snail-1(RNAi), (G-I) snail-2(RNAi), (M-O) snail-1+2(RNAi) and (P-R) zeb-1(RNAi) animals. Brackets indicate the shielded area. Insets show the presence of NBs and early progeny with extended cytoplasmic projections in migratory regions (arrowheads). n=5 per condition. (S) Measurements of distance migrated by NBs (green) and early progeny (magenta) at 7 dpa in snail-1(RNAi), snail-2(RNAi), snail-1+2(RNAi) and zeb-1(RNAi) animals compared with control gfp(RNAi) (n=5). Each dot represents the average distance migrated by the ten most distal cells from each animal. Mean±s.d. Student's t-test, *P<0.05. (T) Quantification of NBs and early progeny with extended processes in snail-1(RNAi), snail-2(RNAi), snail-1+2(RNAi) and zeb-1(RNAi) compared with control gfp(RNAi) animals at 7 dpa (n=5). Mean±s.d. Student's t-test, *P<0.05. See also Figs S5 and S6.

References

    1. Adhikary A., Chakraborty S., Mazumdar M., Ghosh S., Mukherjee S., Manna A., Mohanty S., Nakka K. K., Joshi S., De A. et al. (2014). Inhibition of epithelial to mesenchymal transition by E-cadherin up-regulation via repression of slug transcription and inhibition of E-cadherin degradation: dual role of scaffold/matrix attachment region-binding protein 1 (SMAR1) in breast cancer cells. J. Biol. Chem. 289, 25431-25444. 10.1074/jbc.M113.527267 - DOI - PMC - PubMed
    1. Bardeen C. R. and Baetjer F. H. (1904). The inhibitive action of the Roentgen rays on regeneration in planarians. J. Exp. Zool. 1, 191-195. 10.1002/jez.1400010107 - DOI
    1. Batlle E., Sancho E., Francí C., Domínguez D., Monfar M., Baulida J. and García de Herreros A. (2000). The transcription factor snail is a repressor of E-cadherin gene expression in epithelial tumour cells. Nat. Cell Biol. 2, 84-89. 10.1038/35000034 - DOI - PubMed
    1. Belgiovine C., Chiesa G., Chiodi I., Frapolli R., Bonezzi K., Taraboletti G., D'Incalci M. and Mondello C. (2016). Snail levels control the migration mechanism of mesenchymal tumor cells. Oncol. Lett. 12, 767-771. - PMC - PubMed
    1. Blanco M. J., Moreno-Bueno G., Sarrio D., Locascio A., Cano A., Palacios J. and Nieto M. A. (2002). Correlation of Snail expression with histological grade and lymph node status in breast carcinomas. Oncogene 21, 3241-3246. 10.1038/sj.onc.1205416 - DOI - PubMed

MeSH terms

Substances