. 2017 Sep 26;114(39):10449-10454.
doi: 10.1073/pnas.1701428114. Epub 2017 Sep 11.

CD1d-Restricted pathways in hepatocytes control local natural killer T cell homeostasis and hepatic inflammation

Affiliations

CD1d-Restricted pathways in hepatocytes control local natural killer T cell homeostasis and hepatic inflammation

Sebastian Zeissig et al. Proc Natl Acad Sci U S A. .

Abstract

Invariant natural killer T (iNKT) cells recognize lipid antigens presented by CD1d and play a central role in regulating immunity and inflammation in peripheral tissues. However, the mechanisms which govern iNKT cell homeostasis after thymic emigration are incompletely understood. Here we demonstrate that microsomal triglyceride transfer protein (MTP), a protein involved in the transfer of lipids onto CD1d, regulates liver iNKT cell homeostasis in a manner dependent on hepatocyte CD1d. Mice with hepatocyte-specific loss of MTP exhibit defects in the function of CD1d and show increased hepatic iNKT cell numbers as a consequence of altered iNKT cell apoptosis. Similar findings were made in mice with hepatocyte-specific loss of CD1d, confirming a critical role of CD1d in this process. Moreover, increased hepatic iNKT cell abundance in the absence of MTP is associated with susceptibility to severe iNKT cell-mediated hepatitis, thus demonstrating the importance of CD1d-dependent control of liver iNKT cells in maintaining immunological homeostasis in the liver. Together, these data demonstrate an unanticipated role of parenchymal cells, as shown here for hepatocytes, in tissue-specific regulation of CD1d-restricted immunity and further suggest that alterations in lipid metabolism may affect iNKT cell homeostasis through effects on CD1d-associated lipid antigens.

Keywords: CD1d; NKT cells; hepatocyte.


Conflict of interest statement

The authors declare no conflict of interest.

Figures

Fig. 1.
Fig. 1.
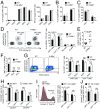
Mttp-deficient hepatocytes show defects in CD1d. (A and B) Transcription of Mttp exons (qPCR) in primary hepatocytes of H-Mttp−/− (B) and WT mice (A). (C) Mean fluorescence intensity (MFI) of CD1d (1B1) on primary hepatocytes (flow cytometry). (D) Cell-surface staining of CD1d on primary hepatocytes by the indicated antibodies (flow cytometry). Polycl., polyclonal. (E) Blocking of α-GalCer presentation to the iNKT cell hybridoma 24.7 by the indicated antibodies. (F) Cd1d1 mRNA (qPCR) in purified hepatocytes. (GI) Presentation by primary hepatocytes of α-GalCer to the iNKT cell hybridoma 24.7 (G and I) or of SIINFEKL to the T cell hybridoma RF33.70 (H). Results are representative of two independent experiments and based on three (A, B, and F) or individual (C and D) mice per group. In E and GI, results of triplicates are shown. Mean (AI) ± SEM (A, B, and EI) is shown. For statistical analysis, the Mann–Whitney U test (A and B), unpaired Student’s t test (F, G, and I), and ANOVA followed by Dunnett’s multiple comparison test (E) were applied.
Fig. 2.
Fig. 2.
Hepatocyte MTP regulates liver iNKT cell homeostasis. (AC) Percentage of hepatic iNKT cells expressing the indicated cell-surface markers (A, Left, B, and C) or MFI of markers (A, Right) on hepatic iNKT cells. DN, double-negative. (D) Percentage of iNKT cells among hepatic TCR Vβ+ cells and of conventional T cells, NK cells, and B cells among liver mononuclear cells. (E) Absolute number of hepatic iNKT cells. Each dot represents one mouse. Bars indicate the median. (F) Percentage of iNKT cells among splenocytes and mesenteric lymph node (MLN) and peripheral lymph node (PLN) cells. (G) Representative plots (Left) and quantification (Right) of BrdU+ cells among hepatic iNKT and conventional T cells. (H) Percentage of hepatic iNKT and conventional T cells expressing the indicated chemokine receptor. (I and J) Percentage of annexin V+ iNKT and conventional T cells in the liver (I) and spleen (J). The histogram in I, Left is gated on iNKT cells. Results are representative of two independent experiments and based on 3 (AC), 10 (D), 8 WT and 7 H-Mttp−/− (E), 4 WT and 6 H-Mttp−/− (F), 3 WT and 6 H-Mttp−/− (G), 5 WT and 7 H-Mttp−/− (H), and 4 WT and 5 H-Mttp−/− (I and J) mice per group. Mean ± SEM is shown (AD and FJ). For statistical analysis, the Mann–Whitney U test (E) or unpaired Student’s t test (D and FJ) was applied. NS, not significant.
Fig. S1.
Fig. S1.
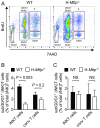
Mice with hepatocyte-specific deletion of Mttp exhibit decreased cell death of liver but not splenic iNKT cells. (A) Representative pseudocolor plots demonstrating the gating of the apoptotic subG0/G1 fraction among gated α-GalCer/CD1d-tetramer+ CD3+ iNKT cells of liver mononuclear cells in the indicated mice. (B and C) Quantification of apoptotic (subG0/G1 fraction) α-GalCer/CD1d-tetramer+ CD3+ iNKT cells and α-GalCer/CD1d-tetramer–negative CD3+ conventional cells among liver (B) and spleen (C) mononuclear cells. Results are representative of two independent experiments and based on three mice per group. Mean ± SEM is shown. For statistical analysis, the unpaired Student’s t test was applied. NS, not significant.
Fig. 3.
Fig. 3.
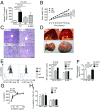
MTP-dependent regulation of hepatic iNKT cells is not the consequence of hepatic steatosis. (A) Hepatic triglyceride (TG) content after 10 wk on a regular control (CTR), high-fat, or high-sucrose diet. (B) Body weight of WT mice. (C and D) H&E (C) and macroscopic appearance (D; WT mice) of livers at week 10 of the respective diets. H-Mttp−/− mice were on the control diet. (Scale bar, 50 μm.) (E) Histograms and MFI of CD1d (1B1) and H-2kb by primary hepatocytes of WT mice at week 10 of the diets (flow cytometry). (F) Cd1d1 mRNA (qPCR) in purified hepatocytes. (G) α-GalCer presentation by primary hepatocytes to the iNKT cell hybridoma 24.7. (H) Percentage of iNKT cells among hepatic TCR Vβ+ cells and of conventional T cells among LMNCs at week 10 of the respective diet. Results are representative of two independent experiments and based on six to eight (A and B), three (E and F), and five to seven (H) mice per group. In G, results of triplicates are shown. Mean ± SEM is shown in A, B, and EG. Statistical analysis was performed using ANOVA followed by Dunnett’s test (A, B, E, and F).
Fig. 4.
Fig. 4.
Liver iNKT cell apoptosis is regulated by hepatocyte CD1d. (A and B) Percentage of iNKT cells among TCR Vβ+ cells and of conventional T cells among CD45+ cells in the liver (A) and spleen (B). (C) Percentage of annexin V+ cells among hepatic iNKT cells and conventional T cells. (D) Percentage of annexin V+ iNKT cells after coculture of WT liver mononuclear cells with primary hepatocytes of the indicated genotype. Results are representative of two independent experiments and based on four (A and B) and three (C) mice per group. In D, results of triplicates are shown. Mean ± SEM is shown. Statistical analysis was performed using the Student’s t test (AC) or ANOVA followed by Dunnett’s test (D).
Fig. 5.
Fig. 5.
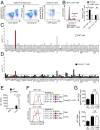
Hepatocyte MTP regulates NKT cell apoptosis and susceptibility to hepatitis. (A) Representative plots of hepatic NKT cells in 4Get mice. (B) Percentage of annexin V+ cells among hepatic GFP+ CD3+ NKT and GFP CD3+ conventional T cells in the indicated mice. Representative histograms of GFP+ CD3+ NKT cells are shown (Left). (C and D) RNA expression of regulators of cell death in sorted hepatic GFP+ CD3+ NKT cells (C) and GFP CD3+ conventional T cells (D) from H-Mttp−/−;4Get and Alb-Cre–negative Mttpfl/fl;4Get (WT) mice. RNA expression is shown as fold of WT. (E) Serum ALT 24 h after ConA. (F) Annexin V+ staining of hepatic iNKT cells and conventional T cells 90 min after ConA. (G) Expression of CD25 (Upper) and CD69 (Lower) on iNKT cells 12 h after ConA or vehicle (PBS). Results in C and D were obtained using cells pooled from 10 mice per group. Results in B and EG are based on 5 WT;4Get and 4 H-Mttp−/−;4Get (B), 10 WT and 12 H-Mttp−/− (E and F), and 5 ConA-treated H-Mttp−/− and 6 ConA- and 6 PBS-treated WT (G) mice. Mean (BE and G) ± SEM (B, E, and G) is shown. Statistical analysis in B, E, and G was performed using the Student’s t test.
Fig. S2.
Fig. S2.
Expression of regulators of cell death in iNKT cells and conventional T cells of mice with hepatocyte-specific deletion of Mttp. RNA expression of selected regulators of cell death in sorted hepatic (A) and splenic (B) αGalCer/CD1d-tetramer+ CD3+ iNKT cells and αGalCer/CD1d-tetramer CD3+ conventional T cells obtained from H-Mttp−/− mice and Alb-Cre–negative Mttpfl/fl (WT) littermates. RNA expression is shown as fold of WT cells. Results are based on four mice per group, whose liver or spleen mononuclear cells were pooled before FACS sorting and qPCR.

Similar articles

Cited by

References

    1. Godfrey DI, Uldrich AP, McCluskey J, Rossjohn J, Moody DB. The burgeoning family of unconventional T cells. Nat Immunol. 2015;16:1114–1123. - PubMed
    1. Gapin L, Godfrey DI, Rossjohn J. Natural killer T cell obsession with self-antigens. Curr Opin Immunol. 2013;25:168–173. - PMC - PubMed
    1. Brennan PJ, Brigl M, Brenner MB. Invariant natural killer T cells: An innate activation scheme linked to diverse effector functions. Nat Rev Immunol. 2013;13:101–117. - PubMed
    1. Thomas SY, et al. PLZF induces an intravascular surveillance program mediated by long-lived LFA-1-ICAM-1 interactions. J Exp Med. 2011;208:1179–1188. - PMC - PubMed
    1. Olszak T, et al. Microbial exposure during early life has persistent effects on natural killer T cell function. Science. 2012;336:489–493. - PMC - PubMed

Publication types

LinkOut - more resources