. 2017 Sep 26;114(39):10443-10448.
doi: 10.1073/pnas.1705599114. Epub 2017 Sep 11.

Intestinal type 1 regulatory T cells migrate to periphery to suppress diabetogenic T cells and prevent diabetes development

Affiliations

Intestinal type 1 regulatory T cells migrate to periphery to suppress diabetogenic T cells and prevent diabetes development

Hua Yu et al. Proc Natl Acad Sci U S A. .

Abstract

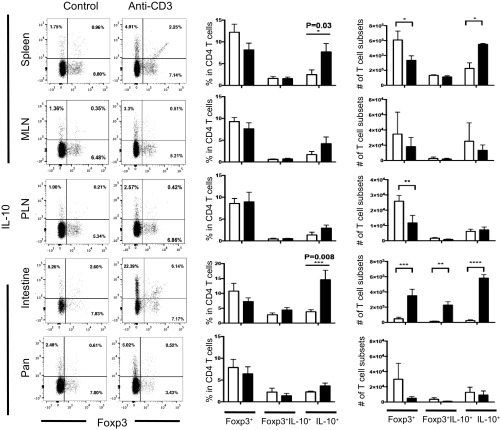
Growing insight into the pathogenesis of autoimmune diseases and numerous studies in preclinical models highlights the potential of regulatory T cells to restore tolerance. By using non-obese diabetic (NOD) BDC2.5 TCR-transgenic (Tg), and IL-10 and Foxp3 double-reporter mice, we demonstrate that alteration of gut microbiota during cohousing experiments or treatment with anti-CD3 mAb significantly increase intestinal IL-10-producing type 1 regulatory T (Tr1) cells and decrease diabetes incidence. These intestinal antigen-specific Tr1 cells have the ability to migrate to the periphery via a variety of chemokine receptors such as CCR4, CCR5, and CCR7 and to suppress proliferation of Th1 cells in the pancreas. The ability of Tr1 cells to cure diabetes in NOD mice required IL-10 signaling, as Tr1 cells could not suppress CD4+ T cells with a dominant-negative IL-10R. Taken together, our data show a key role of intestinal Tr1 cells in the control of effector T cells and development of diabetes. Therefore, modulating gut-associated lymphoid tissue to boost Tr1 cells may be important in type 1 diabetes management.

Keywords: IL-10-producing Tr1 cells; cell migration; diabetes suppression; gut microbiota.


Conflict of interest statement

The authors declare no conflict of interest.

Figures

Fig. 1.
Fig. 1.
Diabetes incidence and the changes of intestinal Tregs in cohoused and noncohoused NOD mice. (A) Cumulative incidence curves for female NOD mice in two housing conditions. Mice were cohoused with dysbiotic inflammasome-deficient mice after weaning. Diabetes development was monitored twice per week starting at 10 wk of age. The difference between the two groups was analyzed by log-rank test (P = 0.06). Percentages (B) and total numbers (C) of IL-10–producing and Foxp3+ T Cells in the intestine of cohoused Foxp3RFP IL-10eGFP double-reporter mice were plotted. Cells were gated on CD4+TCRβ+ cells. Data are pool of two independent experiments and indicated as the mean ± SEM. Open circles, noncohoused reporter mice; black circles, cohoused reporter mice.
Fig. 2.
Fig. 2.
Tr1 cells are generated within small intestine after anti-CD3 treatment. (A) Total numbers of CD4+Foxp3IL-10+, CD4+Foxp3+IL-10+, and CD4+Foxp3+IL-10 cells were pooled from different mouse organs and compared between control mice (white bar) and mice treated with anti-CD3 (black bar). Foxp3 RFP and IL-10 eGFP expression was measured in freshly isolated CD4+TCRβ+ cells. Data represent the mean ± SEM (n = 6 per group) and were analyzed by two-way ANOVA, multiple comparisons test. Results are representative of three independent experiments. (B) TGFβ1,2,3 and IL-27 mRNA levels (mean ± SEM, n = 3) of IEL and LPL isolated from a different part of the small intestine in control mice (white bar) and mice treated with anti-CD3 (black bar). Data were normalized to mouse HPRT. *P < 0.05; **P < 0.01; ***P < 0.001; and ****P < 0.0001.
Fig. S1.
Fig. S1.
Analysis of different T cell subsets after anti-CD3 treatment. Cells were isolated from different organs as indicated. Foxp3 RFP and IL-10 eGFP expression were measured in freshly isolated cells. Cells were gated on CD4+TCRβ+ events (Left). Percentages and numbers of CD4+Foxp3IL-10+, CD4+Foxp3+IL-10+, and CD4+Foxp3+IL-10 cells were compared between control mice (white bar) and mice treated with anti-CD3 (black bar). Data represent the mean ± SEM (n = 6 per group) and were analyzed by two-way ANOVA, multiple comparisons test. Results are representative of three independent experiments. MLN, mesenteric lymph node; Pan, pancreas; PLN, pancreatic lymph node.
Fig. 3.
Fig. 3.
Intestinal Tr1 cells have ability to migrate and suppress diabetes development in vivo. (A) BDC2.5 TCR-Tg CD4+CD25 cells (1 × 10⁵) were injected into NOD-scid mice either alone or coinjected with sorted intestinal Tr1 cells (1 × 10⁵) from BDC2.5 TCR-Tg double-reporter NOD mice. Diabetes incidence was measured for 60 d by urine glucose readings, and positive readings were confirmed by blood glucose analysis. Data were analyzed by log-rank (Mantel–Cox) test. (B) BDC2.5 TCR-Tg CD4+CD25 cells (1 × 10⁵) were injected into NOD-scid mice either alone (open circles) or coinjected with sorted intestinal Tr1 cells (0.2 × 10⁵) from BDC2.5 TCR-Tg double-reporter NOD mice (black circles). Percentages of IFN-γ+ cells were measured in various organs. Each circle represents one mouse. Horizontal bars indicate the mean ± SEM. One experiment of two is shown. Data were analyzed by unpaired Student’s t test. (C) Representative experiment with chemokine receptor staining of Tr1 (red line) and non-Tr1 (blue line) cells isolated from intestine, spleen, and mesenteric lymph node (MLNs). T cells were stained with anti-CCR4, CCR5, CCR7, and CCR9 mAbs. Profile of expression was assessed by flow cytometry. Histogram outlines indicate cytokine-specific staining, and shaded histograms indicate isotype control staining. Results are representative of at least two independent experiments. (D) Representative FACS plots of chemokine receptor expression on Tr1 and non-Tr1 cells isolated from small intestine after anti-CD3 mAb treatment. A portion of Tr1 cells coexpresses CCR4, CCR5, CCR7, and CCR9. (E) NOD-scid mice were intrarectally administered with 0.5 × 10⁶ in vitro-differentiated Tr1 cells. (Top) Schematic of the experiment. Cells were isolated from spleen, LN, MLN, small instestine, colon, and pancreas 2 wk after cell administration. The absolute number of CD4 T cells was determined by flow cytometry. Data were pooled from two independent experiments and are indicated as the mean ± SEM of six mice in total. LN, lymph node; SI, small intestine.
Fig. 4.
Fig. 4.
IL-10 signaling in CD4+ T cells is critical in controlling diabetes development. (A) Individual glycemia values of anti-CD3–treated recent-onset diabetic NOD mice (Left) and CD4–DN–IL-10R NOD mice (Right). Blood glucose concentrations were monitored until 12 wk posttreatment initiation. (B) Percentages of nondiabetic mice in NOD (n = 15) and CD4–DN–IL-10R NOD (n = 12) mice after anti-CD3 treatment. *P = 0.03. Statistical significance between groups was calculated using a log-rank (Mantel–Cox) test. (C) IL-10R expression was measured by flow cytometry. Cells were gated on CD4+CD25 T cells, and Th1 (CD4+IFNγ+) cells were isolated from the spleen of a prediabetic and diabetic mouse. Results are representative of at least two independent experiments.
Fig. 5.
Fig. 5.
In vitro-generated Tr1 cells have a different capacity in suppressing diabetes development. (A) Total CD4 and memory CD4 T cells were cultured for 5 d with anti-CD3 and anti-CD28 in the presence of mouse recombinant TGF-β and IL-27. Percentages of Tr1 cells were compared after in vitro differentiation. Statistical significance was determined by using a paired Student t test. Data are means ± SEM of four independent experiments. (B) BDC2.5 TCR-Tg CD4+CD25 cells (1 × 10⁵) were injected into NOD-scid mice either alone or coinjected with in vitro-differentiated Tr1 cells from total CD4 T cells. (C) BDC2.5 TCR-Tg CD4+CD25 Teff cells (1 × 10⁵) from wild-type or CD4–DN–IL-10R NOD mice were injected into NOD-scid either alone or coinjected with in vitro-differentiated Tr1 cells from memory CD4 T cells. Statistical significance was determined by log-rank (Mantel–Cox) test. (D) Cytokine production by CD4 T cells was analyzed intracellularly with flow cytometry and compared between wild-type and CD4–DN–IL-10R NOD mice. Percentages of the IFN-γ–producing T cells are indicated. Data are representative of three independent experiments.
Fig. S2.
Fig. S2.
Cytokine expression of Tr1 cells measured after 2 wk adoptive transfer into lymphopenic mice. Tr1 cells were differentiated from either total or memory CD4 T cells and then injected into NOD-scid mice. (A) Two weeks later, IL-10 eGFP expression was measured in freshly isolated cells from NOD-scid mice. Cells were gated on CD4+TCRβ+ events. (B) Cells from the spleen were also restimulated with PMA, and Ionomycin and intracellular cytokine staining for IL-17A and IFN-γ was performed. Plots were gated on CD4+TCRβ+ events. Data are representative of at least three independent experiments.

References

    1. Mathis D, Vence L, Benoist C. β-Cell death during progression to diabetes. Nature. 2001;414:792–798. - PubMed
    1. Silverstein J, et al. Immunosuppression with azathioprine and prednisone in recent-onset insulin-dependent diabetes mellitus. N Engl J Med. 1988;319:599–604. - PubMed
    1. Keymeulen B, et al. Insulin needs after CD3-antibody therapy in new-onset type 1 diabetes. N Engl J Med. 2005;352:2598–2608. - PubMed
    1. Keller RJ, Eisenbarth GS, Jackson RA. Insulin prophylaxis in individuals at high risk of type I diabetes. Lancet. 1993;341:927–928. - PubMed
    1. Diabetes Prevention Trial–Type 1 Diabetes Study Group Effects of insulin in relatives of patients with type 1 diabetes mellitus. N Engl J Med. 2002;346:1685–1691. - PubMed

Publication types

MeSH terms