. 2017 Nov 13;37(23):e00441-17.
doi: 10.1128/MCB.00441-17. Print 2017 Dec 1.

MTORC1 Regulates both General Autophagy and Mitophagy Induction after Oxidative Phosphorylation Uncoupling

Affiliations

MTORC1 Regulates both General Autophagy and Mitophagy Induction after Oxidative Phosphorylation Uncoupling

Alberto Bartolomé et al. Mol Cell Biol. .

Abstract

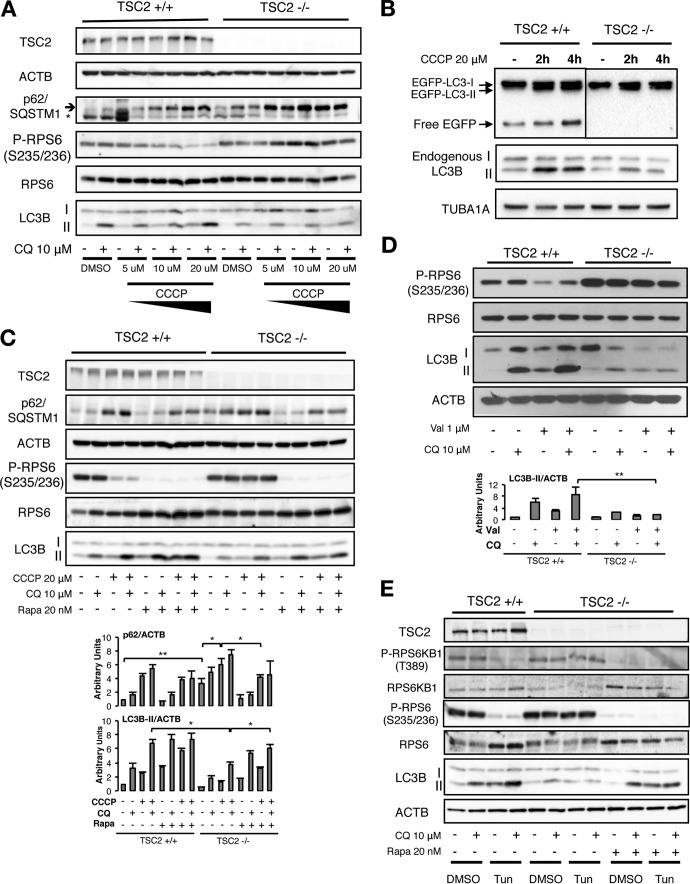
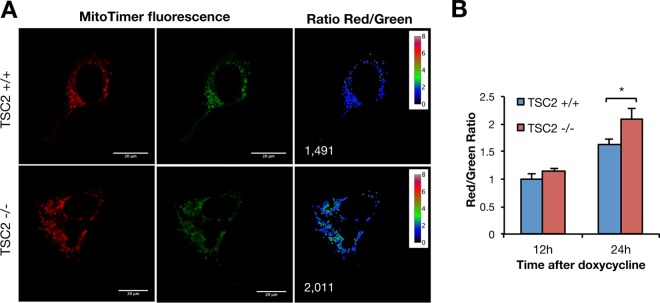
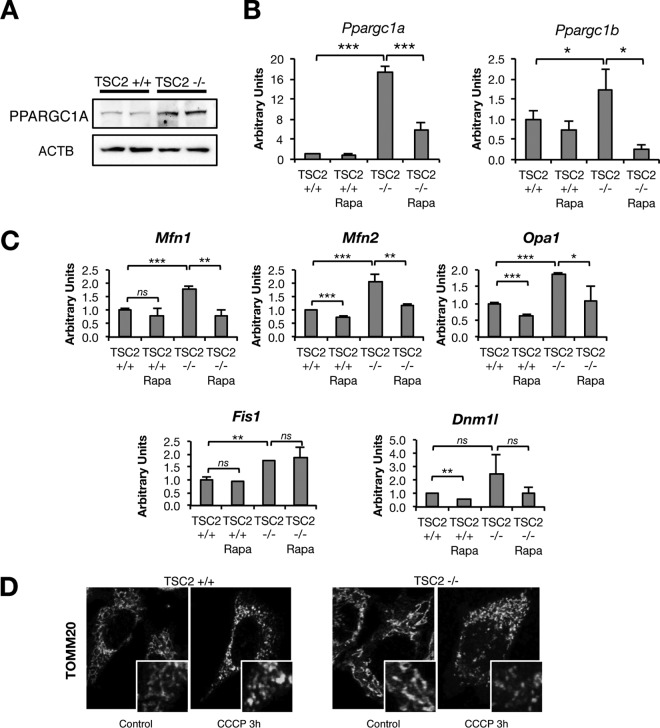
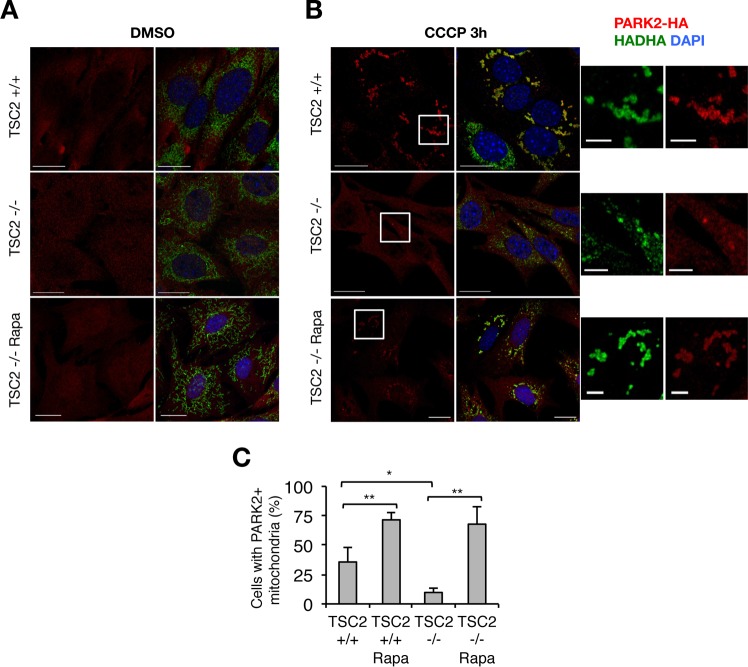
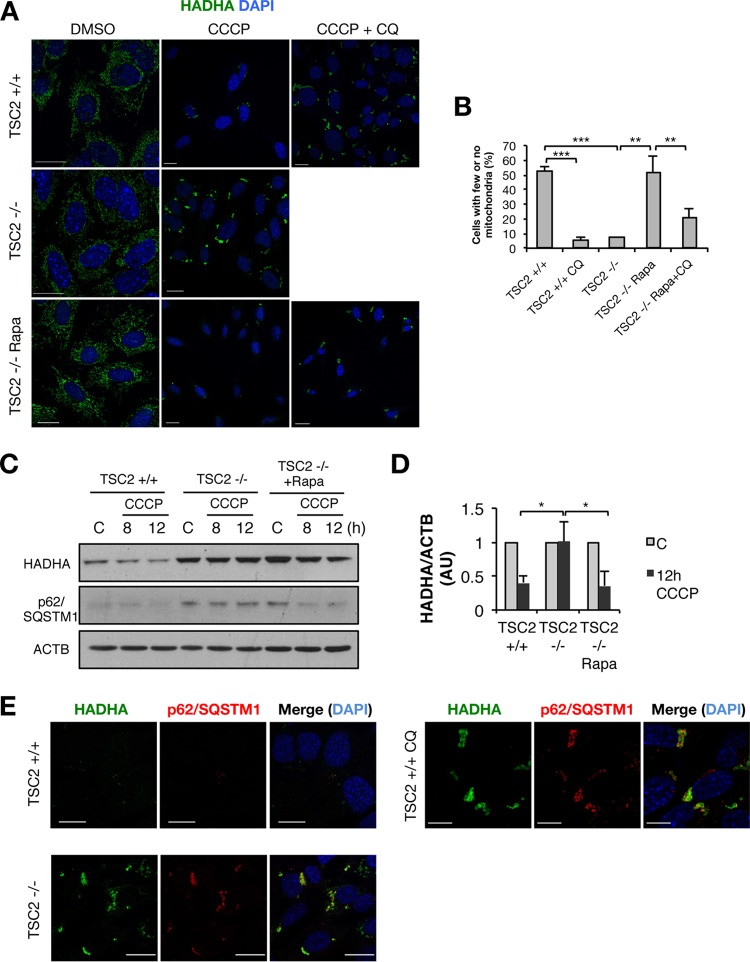
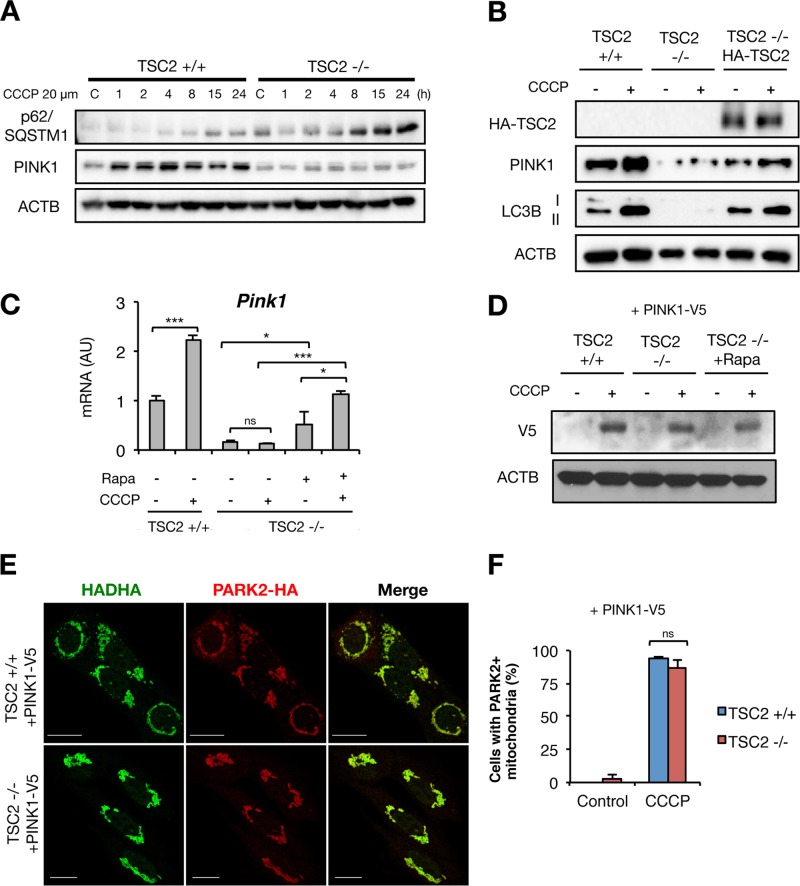
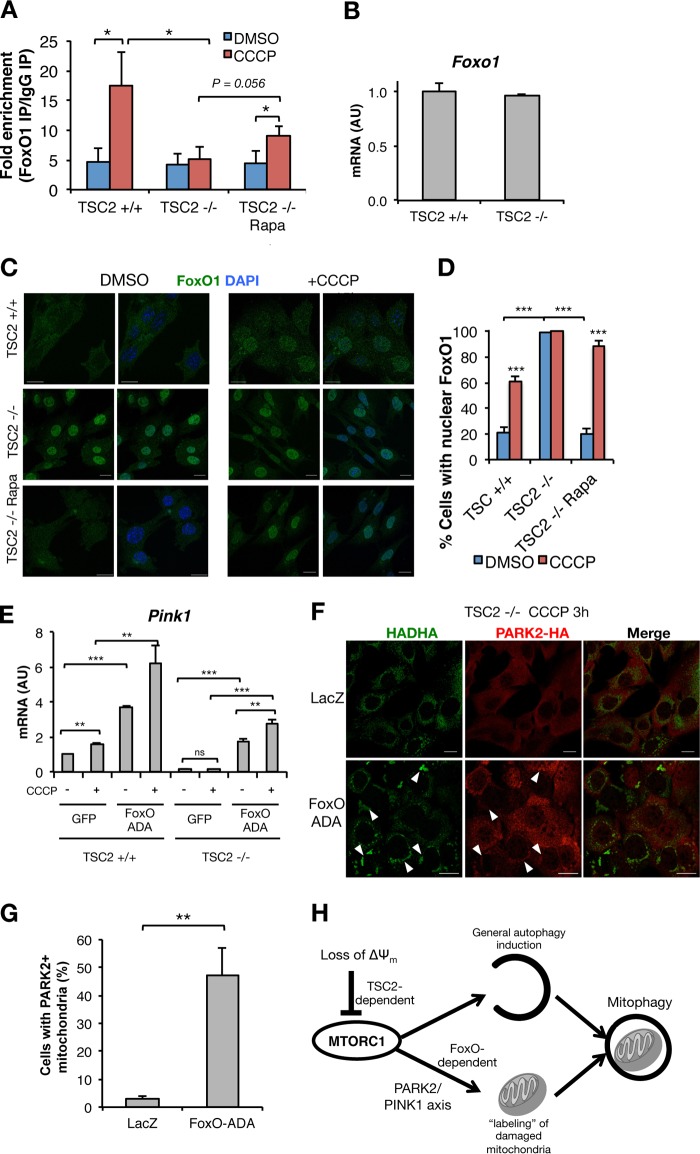
Mechanistic target of rapamycin complex 1 (MTORC1) is a critical negative regulator of general autophagy. We hypothesized that MTORC1 may specifically regulate autophagic clearance of damaged mitochondria. To test this, we used cells lacking tuberous sclerosis complex 2 (TSC2-/- cells), which show constitutive MTORC1 activation. TSC2-/- cells show MTORC1-dependent impaired autophagic flux after chemical uncoupling of mitochondria, increased mitochondrial-protein aging, and accumulation of p62/SQSTM1-positive mitochondria. Mitochondrial autophagy (mitophagy) was also deficient in cells lacking TSC2, associated with altered expression of PTEN-induced putative kinase 1 (PINK1) and PARK2 translocation to uncoupled mitochondria, all of which were recovered by MTORC1 inhibition or expression of constitutively active forkhead box protein O1 (FoxO1). These data prove the necessity of intact MTORC1 signaling to regulate two synergistic processes required for clearance of damaged mitochondria: (i) general autophagy initiation and (ii) PINK1/PARK2-mediated selective targeting of uncoupled mitochondria to the autophagic machinery.

Keywords: MTORC1; PINK1; TSC2; autophagy; mitophagy; rapamycin.


Figures

FIG 1
FIG 1
MTORC1-dependent autophagy induction by CCCP. (A) Western blots from TSC2+/+ or TSC2−/− MEFs treated with different doses of the mitochondrial uncoupler CCCP for 15 h in the presence or absence of 10 μM CQ. (B) Western blots from TSC2+/+ or TSC2−/− MEFs expressing the fusion protein EGFP-LC3 stimulated with CCCP for the indicated times. As EGFP is more resistant to lysosomal hydrolases than LC3B, the appearance of free EGFP is indicative of autolysosome activity. (C) Western blots from TSC2+/+ or TSC2−/− MEFs stimulated with CCCP with or without CQ in the presence or absence of 20 nM rapamycin (Rapa), with densitometric quantification of p62/SQSTM and LC3-II. (D) Western blots from TSC2+/+ or TSC2−/− MEFs stimulated for 15 h with 1 μM valinomycin (Val) with or without CQ in the presence or absence of Rapa, with densitometric quantification of LC3-II. The values represent means and standard deviations (SD); n = 3 independent experiments. (E) Western blots from TSC2+/+ or TSC2−/− MEFs stimulated for 15 h with 2 μg/ml tunicamycin (Tun) with or without CQ in the presence or absence of Rapa. The values represent means and SD; n = 3 independent experiments. *, P < 0.05; **, P < 0.01 compared to the indicated control.
FIG 2
FIG 2
TSC2-deficient cells show increased mitochondrial aging. (A) Representative images of TSC2+/+ and TSC2−/− MEFs, stably expressing rtTA3, transfected with the doxycycline-inducible MitoTimer probe and then pulsed with doxycycline prior to visualization after 24 h. Ratiometric images representing the red/green ratio (MitoTimer fluorescence shifts from green to red with time) are also shown; the value of the ratio is represented as intensity and color coded as indicated in the scales. The numbers represent the specific ratios of the images shown. (B) Quantification of the red/green ratios 12 and 24 h after doxycycline pulse. The values represent means and SD (n = 3 independent experiments). *, P < 0.05 compared to the indicated control.
FIG 3
FIG 3
MTORC1-dependent expression of genes involved in mitochondrial dynamics. (A) Western blots from TSC2+/+ and TSC2−/− MEF lysates. (B and C) qPCR analysis of TSC2+/+ or TSC2−/− MEFs treated with Rapa or vehicle for 15 h. (D) TOMM20 staining in TSC2+/+ and TSC2−/− MEFs stimulated with CCCP for 3 h. The values represent means and SD (n = 3 to 5 independent experiments). *, P < 0.05; **, P < 0.01; ***, P < 0.001 compared to the indicated control.
FIG 4
FIG 4
Impaired PARK2 mitochondrial translocation in TSC2-deficient cells. (A and B) Representative images of PARK2-HA localization in TSC2+/+ and TSC2−/− MEFs with or without 3 h of CCCP exposure and/or 15 h of Rapa pretreatment. Bars, 20 μm; bars in magnified images, 50 μm. DMSO, dimethyl sulfoxide; DAPI, 4′,6-diamidino-2-phenylindole. (C) Quantification of cells with PARK2-positive mitochondria in CCCP-treated cells from the experiment shown in panel B. The values represent means and SD (n = 3 independent experiments). *, P < 0.05; **, P < 0.01 compared to the indicated control.
FIG 5
FIG 5
Impaired mitophagy in TSC2-deficient cells. (A) PARK2-HA-expressing TSC2+/+ and TSC2−/− MEFs were stimulated with CCCP with or without CQ and/or Rapa for 20 h and then assayed for mitochondria by staining of the mitochondrial matrix protein HADHA. (B) Quantification of the percentages of cells with few or no mitochondria. (C) Western blots from PARK2-HA-expressing TSC2+/+ and TSC2−/− MEFs stimulated with CCCP with or without Rapa for the indicated times. (D) Densitometric analysis of HADHA/ACTB, represented as change from the basal value. AU, arbitrary units. (E) Representative confocal images of mitochondria (HADHA) and p62/SQSTM1 in PARK2-HA-expressing TSC2+/+ and TSC2−/− MEFs stimulated with CCCP for 20 h. The values represent means and SD (n = 3 independent experiments). *, P < 0.05; **, P < 0.01; ***, P < 0.001 compared to the indicated control.
FIG 6
FIG 6
MTORC1-dependent PINK1 expression. (A and B) Western blots from TSC2+/+ and TSC2−/− MEFs stimulated with CCCP for the indicated times (A) or with reconstituted TSC2 (B). (C) qPCR in TSC2+/+ and TSC2−/− MEFs pretreated with Rapa for 24 h and then exposed to CCCP for 15 h. (D) Western blots from TSC2+/+ and TSC2−/− MEFs stably expressing PINK1-V5 and treated with CCCP for 3 h. (E) PARK2 localization in TSC2+/+ and TSC2−/− MEFs stably expressing PARK2-HA and PINK1-V5 and treated with CCCP for 3 h. (F) Quantification of cells with PARK2-positive mitochondria. The values represent means and SD (n = 3 to 5 independent experiments). *, P < 0.05; ***, P < 0.001; ns, not significant compared to the indicated control.
FIG 7
FIG 7
FoxO-ADA rescues Pink1 expression and PARK2 translocation to mitochondria. (A) ChIP, using anti-FoxO1 or IgG control, in TSC2+/+ and TSC2−/− MEFs stimulated with CCCP or vehicle for 15 h with or without Rapa pretreatment, followed by qPCR for the Pink1 promoter region. (B) qPCR in TSC2+/+ and TSC2−/− MEFs. (C and D) Representative images of FoxO1 localization (C) and percentages of cells with nuclear FoxO1 (D) in TSC2+/+ and TSC2−/− MEFs stimulated with CCCP or vehicle for 15 h, with or without Rapa pretreatment. (E) qPCR in TSC2+/+ and TSC2−/− MEFs transduced with adenovirus encoding GFP or FoxO-ADA, with or without 15 h of exposure to CCCP. (F and G) Representative images of PARK2 mitochondrial localization (arrowheads) (F) and percentages of cells with PARK2+ mitochondria (G) in TSC2+/+ and TSC2−/− MEFs stably expressing PARK2-HA and transduced with LacZ or FoxO-ADA and then treated for 3 h with CCCP. The values represent means and SD (n = 3 to 5 independent experiments). *, P < 0.05; **, P < 0.01; ***, P < 0.001; ns, not significant compared to the indicated control. (H) Model in which loss of ΔΨm leads to TSC2-dependent MTORC1 inhibition, fundamental to coordinating two synergistic MTORC1-dependent processes—autophagy initiation and labeling of the cargo to be degraded, enabling its recognition by the autophagic machinery—to execute the clearance of damaged mitochondria.

References

    1. Ravikumar B, Sarkar S, Davies JE, Futter M, Garcia-Arencibia M, Green-Thompson ZW, Jimenez-Sanchez M, Korolchuk VI, Lichtenberg M, Luo S, Massey DCO, Menzies FM, Moreau K, Narayanan U, Renna M, Siddiqi FH, Underwood BR, Winslow AR, Rubinsztein DC. 2010. Regulation of mammalian autophagy in physiology and pathophysiology. Physiol Rev 90:1383–1435. doi:10.1152/physrev.00030.2009. - DOI - PubMed
    1. Russell RC, Yuan H-X, Guan K-L. 2014. Autophagy regulation by nutrient signaling. Cell Res 24:42–57. doi:10.1038/cr.2013.166. - DOI - PMC - PubMed
    1. Murrow L, Debnath J. 2013. Autophagy as a stress-response and quality-control mechanism: implications for cell injury and human disease. Annu Rev Pathol 8:105–137. doi:10.1146/annurev-pathol-020712-163918. - DOI - PMC - PubMed
    1. Noda T, Ohsumi Y. 1998. Tor, a phosphatidylinositol kinase homologue, controls autophagy in yeast. J Biol Chem 273:3963–3966. doi:10.1074/jbc.273.7.3963. - DOI - PubMed
    1. Ravikumar B, Vacher C, Berger Z, Davies JE, Luo S, Oroz LG, Scaravilli F, Easton DF, Duden R, O'Kane CJ, Rubinsztein DC. 2004. Inhibition of mTOR induces autophagy and reduces toxicity of polyglutamine expansions in fly and mouse models of Huntington disease. Nat Genet 36:585–595. doi:10.1038/ng1362. - DOI - PubMed

Publication types

MeSH terms

Substances