. 2017 Sep 11;7(1):11239.
doi: 10.1038/s41598-017-10942-6.

ECG features and methods for automatic classification of ventricular premature and ischemic heartbeats: A comprehensive experimental study

Affiliations

ECG features and methods for automatic classification of ventricular premature and ischemic heartbeats: A comprehensive experimental study

Lucie Maršánová et al. Sci Rep. .

Abstract

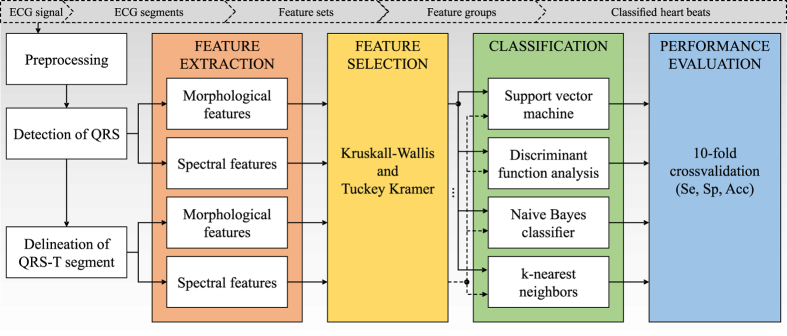
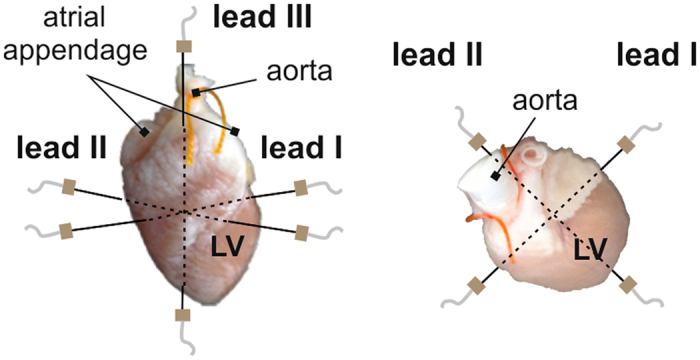
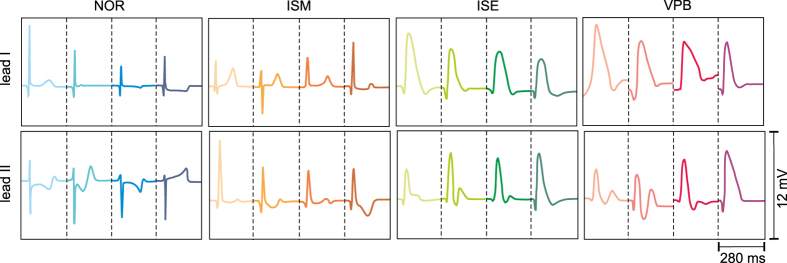
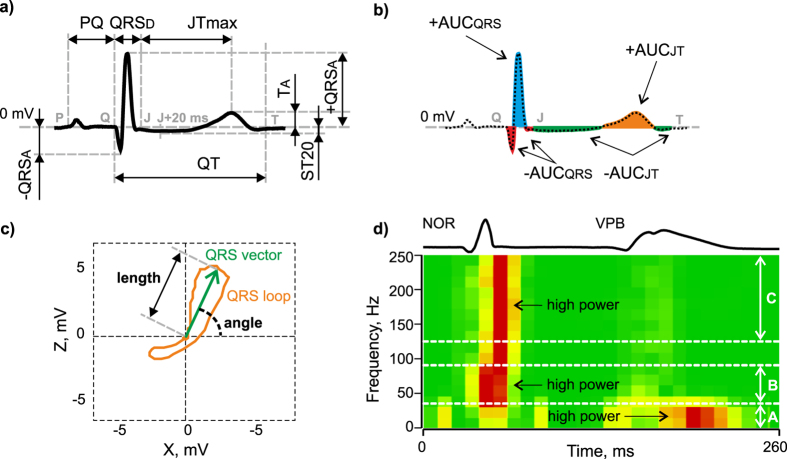
Accurate detection of cardiac pathological events is an important part of electrocardiogram (ECG) evaluation and subsequent correct treatment of the patient. The paper introduces the results of a complex study, where various aspects of automatic classification of various heartbeat types have been addressed. Particularly, non-ischemic, ischemic (of two different grades) and subsequent ventricular premature beats were classified in this combination for the first time. ECGs recorded in rabbit isolated hearts under non-ischemic and ischemic conditions were used for analysis. Various morphological and spectral features (both commonly used and newly proposed) as well as classification models were tested on the same data set. It was found that: a) morphological features are generally more suitable than spectral ones; b) successful results (accuracy up to 98.3% and 96.2% for morphological and spectral features, respectively) can be achieved using features calculated without time-consuming delineation of QRS-T segment; c) use of reduced number of features (3 to 14 features) for model training allows achieving similar or even better performance as compared to the whole feature sets (10 to 29 features); d) k-nearest neighbours and support vector machine seem to be the most appropriate models (accuracy up to 98.6% and 93.5%, respectively).


Conflict of interest statement

The authors declare that they have no competing interests.

Figures

Figure 1
Figure 1
Complete scheme of electrogram processing and heartbeat classification.
Figure 2
Figure 2
Front (left) and top (right) view of orthogonal system of electrodes. LV – left ventricle.
Figure 3
Figure 3
Types of classified QRS-T segments. Segments from four different experiments are shown in each group. NOR, ISM, ISE, VPB – non-ischemic, moderate and severe ischemic beats and ventricular premature beats, respectively.
Figure 4
Figure 4
Selected features definition: (a) interval (QRSD, QT, PQ, and JTmax represent the duration of QRS complex, QT interval, PQ interval, and segment between J point and maximal deviation of T wave, respectively) and voltage (+QRSA, −QRSA, TA, and ST20 represent maximal positive deviation of QRS, maximal negative deviation of QRS, maximal deviation of ST-T interval, and deviation of ST segment 20 ms after QRS offset, respectively) characteristics of ECG; (b) areas under various parts of QRS-T (−AUCQRS, +AUCQRS, −AUCJT, and +AUCJT represent area under negative and positive part of QRS and negative and positive part of ST-T interval, respectively); (c) 2D QRS loop parameters (length and angle of maximal electrical vector of QRS in horizontal plane); (d) spectrogram of QRS used for calculation of (sum of frequency power (normalized for each frequency component separately - created by) in three bands (A – 0–35 Hz, B – 35–90 Hz and C – 125–250 Hz); NOR, VPB - normal and ventricular premature beats, respectively.
Figure 5
Figure 5
Distribution of selected features with significantly different values among all types of heartbeats confirmed by statistical analysis (p < 0.05): (a) QRS complex duration (QRSD), (b) area under segment selected as a part of ECG 60 ms before to 60 ms after R peak position (p60), (c) mean value of QRS in Wigner-Ville distribution within frequency range 0–500 Hz (WVm), (d) mean of continuous wavelet representation of QRS complex (WTm).

References

    1. Mendis, S., Puska, P. & Norrving, B. Global atlas on cardiovascular disease prevention and control. (World Health Organization in collaboration with the World Heart Federation and the World Stroke Organization, c2011).
    1. Fisch C. Centennial of the string galvanometer and the electrocardiogram. Journal of the American College of Cardiology. 2000;36:1737–1745. doi: 10.1016/S0735-1097(00)00976-1. - DOI - PubMed
    1. Correa R, Arini PD, Valentinuzzi ME, Laciar E. Novel set of vectorcardiographic parameters for the identification of ischemic patients. Medical Engineering. 2013;35:16–22. doi: 10.1016/j.medengphy.2012.03.005. - DOI - PubMed
    1. Firoozabadi R, Gregg RE, Babaeizadeh S, Laciar E. Identification of exercise-induced ischemia using QRS slopes. Journal of Electrocardiology. 2016;49:55–59. doi: 10.1016/j.jelectrocard.2015.09.001. - DOI - PubMed
    1. Murthy HSN, Meenakshi DM, Babaeizadeh S, Laciar E. ANN, SVM and KNN Classifiers for Prognosis of Cardiac Ischemia- A Comparison. Bonfring International Journal of Research in Communication Engineering. 2015;5:07–11. doi: 10.9756/BIJRCE.8030. - DOI

Publication types