

A Multi-Institutional Comparison of Dynamic Contrast-Enhanced Magnetic Resonance Imaging Parameter Calculations
- PMID: 28894197
- PMCID: PMC5593829
- DOI: 10.1038/s41598-017-11554-w
A Multi-Institutional Comparison of Dynamic Contrast-Enhanced Magnetic Resonance Imaging Parameter Calculations
Erratum in
-
Publisher Correction: A Multi-Institutional Comparison of Dynamic Contrast-Enhanced Magnetic Resonance Imaging Parameter Calculations.Sci Rep. 2018 Mar 8;8(1):4422. doi: 10.1038/s41598-018-20639-z. Sci Rep. 2018. PMID: 29520065 Free PMC article.
Abstract
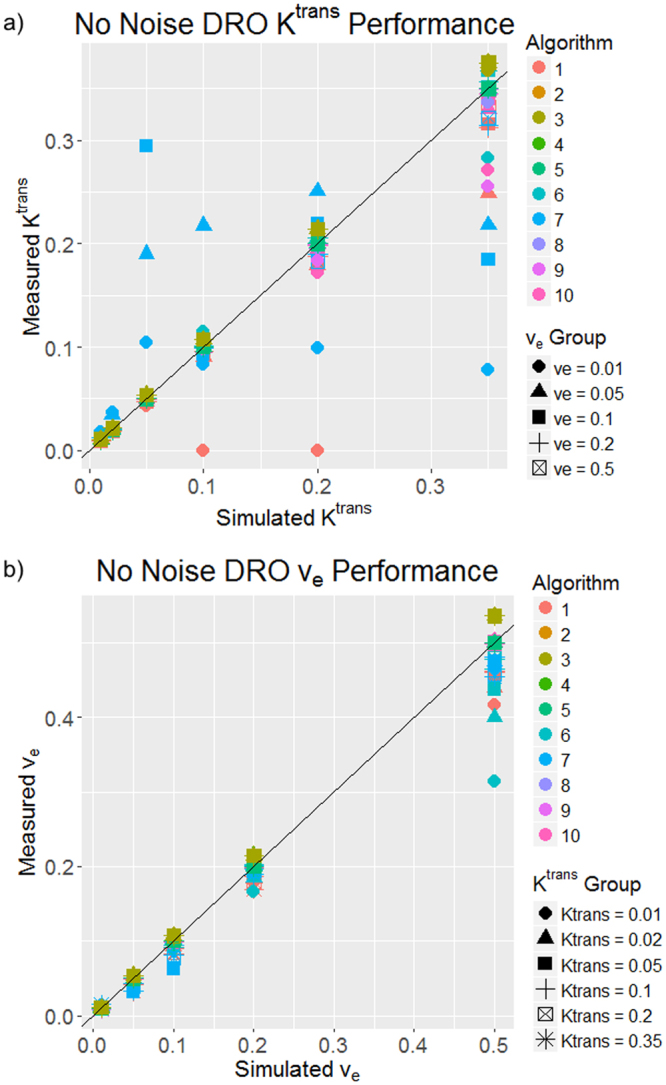
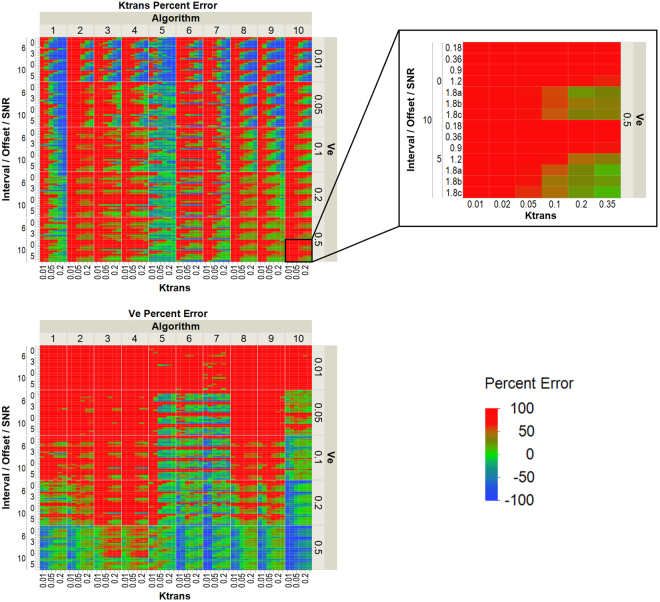
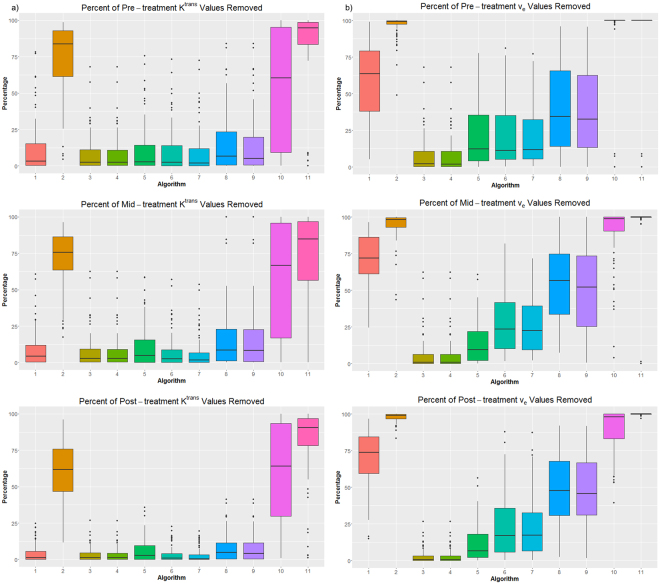
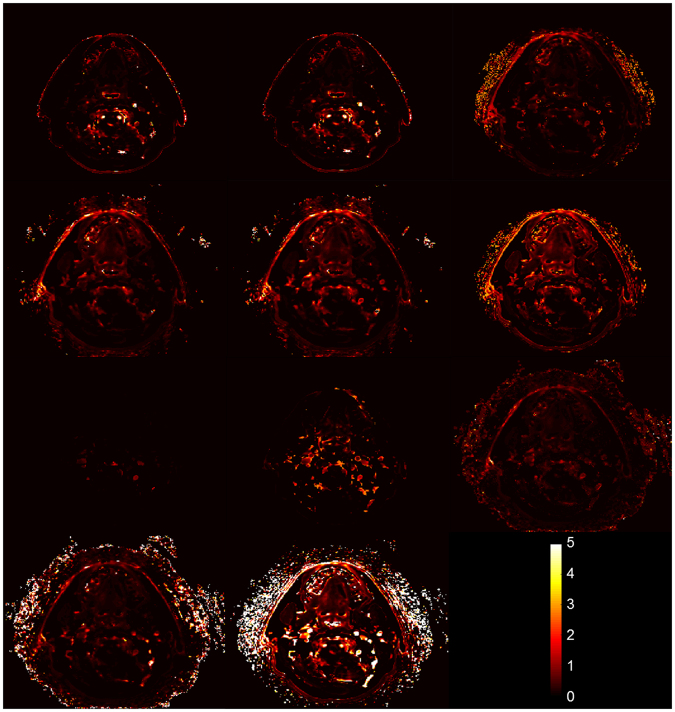
Dynamic contrast-enhanced magnetic resonance imaging (DCE-MRI) provides quantitative metrics (e.g. Ktrans, ve) via pharmacokinetic models. We tested inter-algorithm variability in these quantitative metrics with 11 published DCE-MRI algorithms, all implementing Tofts-Kermode or extended Tofts pharmacokinetic models. Digital reference objects (DROs) with known Ktrans and ve values were used to assess performance at varying noise levels. Additionally, DCE-MRI data from 15 head and neck squamous cell carcinoma patients over 3 time-points during chemoradiotherapy were used to ascertain Ktrans and ve kinetic trends across algorithms. Algorithms performed well (less than 3% average error) when no noise was present in the DRO. With noise, 87% of Ktrans and 84% of ve algorithm-DRO combinations were generally in the correct order. Low Krippendorff's alpha values showed that algorithms could not consistently classify patients as above or below the median for a given algorithm at each time point or for differences in values between time points. A majority of the algorithms produced a significant Spearman correlation in ve of the primary gross tumor volume with time. Algorithmic differences in Ktrans and ve values over time indicate limitations in combining/comparing data from distinct DCE-MRI model implementations. Careful cross-algorithm quality-assurance must be utilized as DCE-MRI results may not be interpretable using differing software.
Conflict of interest statement
The authors declare that they have no competing interests.
Figures
References
-
- Jemal A, et al. Global cancer statistics. CA: a cancer journal for clinicians. 2011;61:69–90. - PubMed
-
- Howlader, N. et al. SEER Cancer Statistics Review, 1975–2014, National Cancer Institute. Bethesda, MD, https://seer.cancer.gov/csr/1975–2014/, based on November 2016 SEER data submission, posted to the SEER web site, April 2017.
Publication types
MeSH terms
Substances
Grants and funding
- U01 CA142565/CA/NCI NIH HHS/United States
- U24 CA180918/CA/NCI NIH HHS/United States
- P30 CA016672/CA/NCI NIH HHS/United States
- L30 CA136381/CA/NCI NIH HHS/United States
- P50 CA097007/CA/NCI NIH HHS/United States
- R01 CA138599/CA/NCI NIH HHS/United States
- R01 DE025248/DE/NIDCR NIH HHS/United States
- R01 CA214825/CA/NCI NIH HHS/United States
- K12 CA088084/CA/NCI NIH HHS/United States
- R56 DE025248/DE/NIDCR NIH HHS/United States
- U01 CA154602/CA/NCI NIH HHS/United States
- R01 CA218148/CA/NCI NIH HHS/United States
- U01 CA154601/CA/NCI NIH HHS/United States
- U24 CA180927/CA/NCI NIH HHS/United States
- R01 CA225190/CA/NCI NIH HHS/United States
- U01 CA174706/CA/NCI NIH HHS/United States
LinkOut - more resources
Full Text Sources
Other Literature Sources
Medical
Molecular Biology Databases
