. 2017 Sep 11;7(1):11216.
doi: 10.1038/s41598-017-11742-8.

Synchronous precipitation reduction in the American Tropics associated with Heinrich 2

Affiliations

Synchronous precipitation reduction in the American Tropics associated with Heinrich 2

Martín Medina-Elizalde et al. Sci Rep. .

Abstract

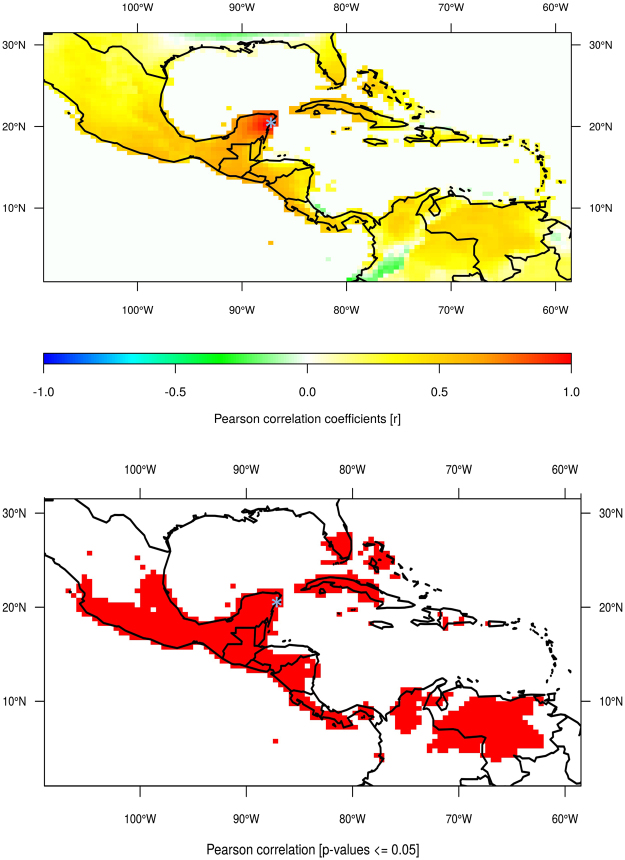
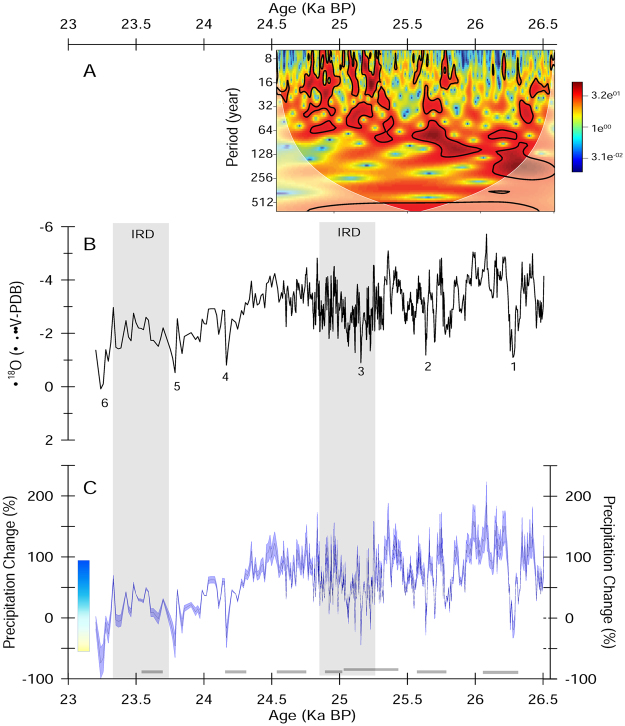
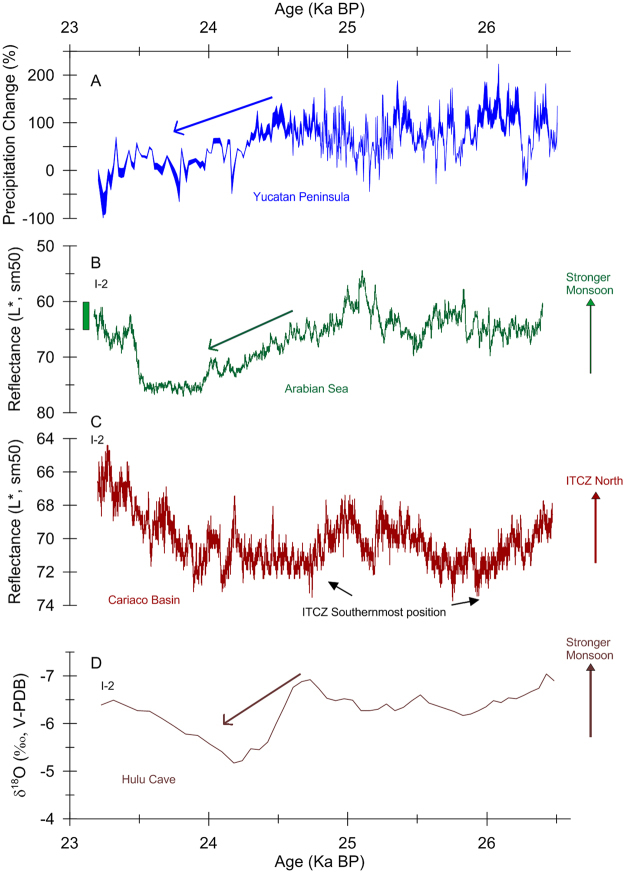
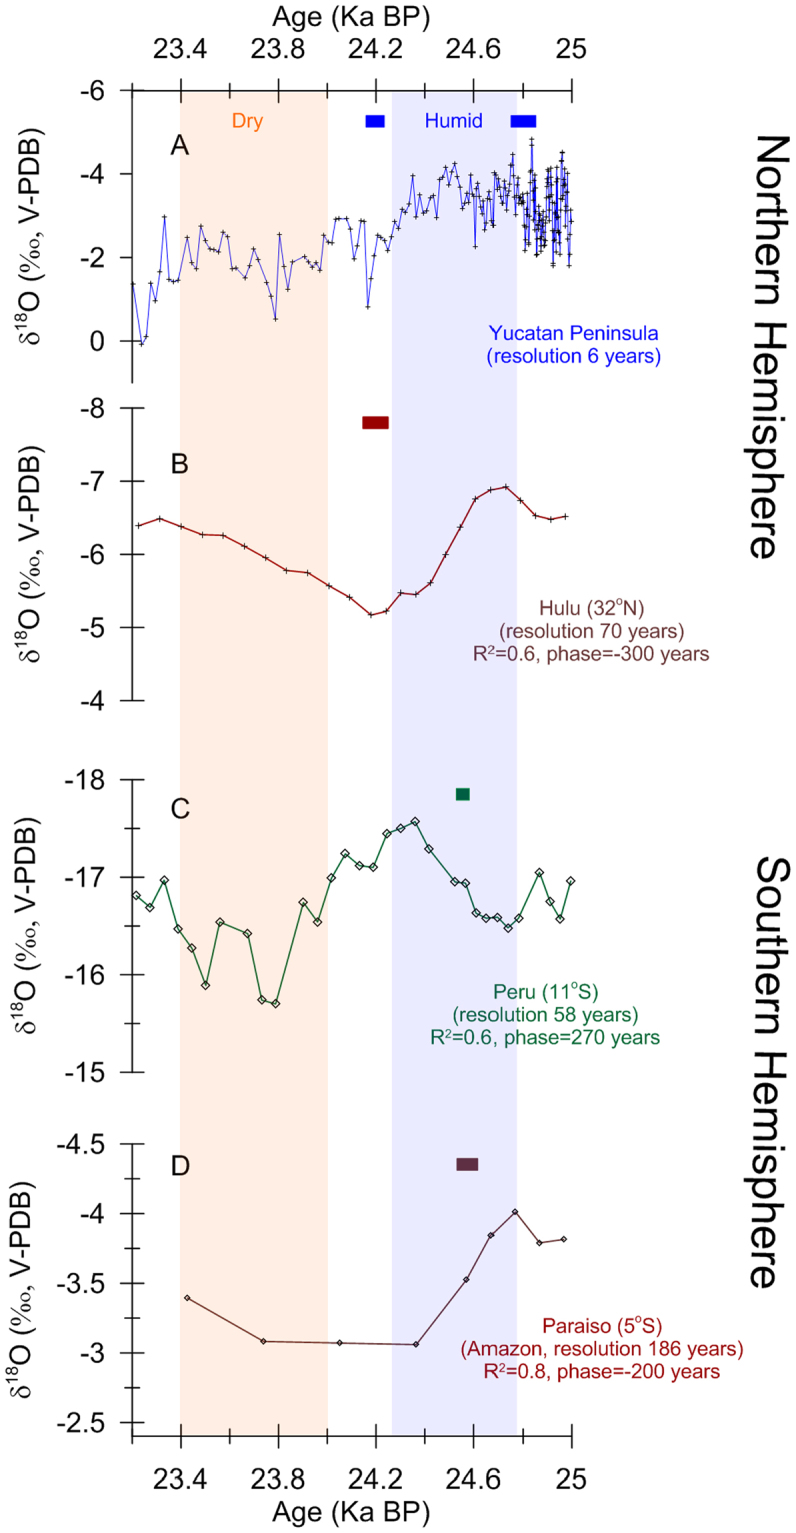
During the last ice age temperature in the North Atlantic oscillated in cycles known as Dansgaard-Oeschger (D-O) events. The magnitude of Caribbean hydroclimate change associated with D-O variability and particularly with stadial intervals, remains poorly constrained by paleoclimate records. We present a 3.3 thousand-year long stalagmite δ18O record from the Yucatan Peninsula (YP) that spans the interval between 26.5 and 23.2 thousand years before present. We estimate quantitative precipitation variability and the high resolution and dating accuracy of this record allow us to investigate how rainfall in the region responds to D-O events. Quantitative precipitation estimates are based on observed regional amount effect variability, last glacial paleotemperature records, and estimates of the last glacial oxygen isotopic composition of precipitation based on global circulation models (GCMs). The new precipitation record suggests significant low latitude hydrological responses to internal modes of climate variability and supports a role of Caribbean hydroclimate in helping Atlantic Meridional Overturning Circulation recovery during D-O events. Significant in-phase precipitation reduction across the equator in the tropical Americas associated with Heinrich event 2 is suggested by available speleothem oxygen isotope records.


Conflict of interest statement

The authors declare that they have no competing interests.

Figures

Figure 1
Figure 1
Spatio-temporal correlation analysis of precipitation (monthly values from 01/1901 to 12/2013 and with a spatial coverage of 0.5° latitude by 0.5° longitude) at the location (20°15′N, 87°45′W) (close to Playa del Carmen, Yucatan, Mexico). Location of Rio Secreto indicated with light blue asterisk. The precipitation data set comes from the GPCC Global Precipitation Climatology Centre and is available from https://www.esrl.noaa.gov/psd/data/gridded/data.gpcc.html. The map was created using the R software.
Figure 2
Figure 2
Itzamna δ18O (panel B) and δ18O-derived precipitation (panel C) records spanning the time interval between 26.4 and 23.2 ka BP from Rio Secreto, Playa del Carmen, Mexico. Precipitation percent change estimates are relative to the mean annual precipitation amount in Playa del Carmen today of 1465 mm (panel B). These records have a resolution during the time interval between 26.5 and 24.6 ka BP of 3.4 ± 1.3 years (1 SD) and between 24.6 and 23.2 ka BP of 16 ± 6.7 years (1 SD). Precipitation change estimates (blue shading) reflect reference values of calcite precipitated under isotopic equilibrium conditions with last glacial dripwater temperature (18–20 °C) and an amount effect (δP/ΔP) ranging from −0.0168‰ per mm to −0.0106‰ per mm, corresponding to the 80% confidence interval of the amount effect slope based on instrumental data (see Methods section for more details). Average precipitation change is indicated by the blue the line within blue shading. Reference equilibrium values were calculated using the paleotemperature equation by ref. . The potential bias in our precipitation estimates due to shifts in annual precipitation amount seasonality is ±8% in the range of 55 to 70% summer contribution to annual precipitation (see Methods section). Vertical box on the left of panel B; indicates precipitation variability observed today in the northeast of the YP (mean = 1390 mm per year; range 670 mm to 2664 mm per year), based on the longest continuous instrumental record of precipitation available for this region (i.e. Kantunilkil Station). The record covers Stadial 2 and Heinrich event 2 (H2). Vertical grey bars reflect the two peak IRD depositional phases associated with H2, centered at 25 ± 0.2 ka BP and 23.5 ± 0.2 ka BP. The six significant positive δ18O shifts discussed in the manuscript are indicated with numbers. Top image (panel A), represents a wavelet spectral power analysis of the Itzamna δ18O record. The area outside the white lines indicates the cone of influence where the edge effects of the wavelet transform and uncertainties become important and the black contours reflect statistically significant power spectra (CI = 95%). Wavelet spectral power is based on methods by refs , , as implemented in the R package “biwavelet”.
Figure 3
Figure 3
(A) Itzamna stalagmite precipitation record (this study), (B) northeastern Arabian sea sediment reflectance L* record and (C) Cariaco Basin, northern Venezuela, sediment reflectance L* record. Arrows illustrate weakening of YP precipitation and Indian monsoon. Green vertical bar in panel B represents the Arabian Sea sediment reflectance range reflecting Holocene values. This range illustrates that the intensity of the Indian Monsoon was not significantly different in the early stages of S2 than during the Holocene. For reference, Cariaco Basin sediment L* reflectance values associated with previous stadial episodes (e.g. stadials 3–18) were lower than the lowest S2 values, thus suggesting that the Atlantic ITCZ was not particularly displaced south during S2 relative to a typical stadial. Differences in the timing of interstadial 2 among these records reflect chronological uncertainties >200 years, .
Figure 4
Figure 4
Blow up comparing speleothem δ18O records from the northern and the southern Hemispheres between 25 and 23.2 ka BP. Speleothem δ18O record from the Yucatan Peninsula (20°N) (A), Hulu, China (32°N) (B), Perú (11°S) (C), and Paraíso, Amazon Basin (5°S) (D). The time resolution of these records is shown. Cross-correlation coefficient (r2) and phase relationship between the YP speleothem δ18O record and the other speleothem δ18O records are shown. Negative/positive phase values represent that the YP δ18O record lags/leads the other speleothem δ18O records, respectively. These records are in phase within their combined age uncertainties. Small color box above each record shows the U-Th age and its uncertainty (2 Sigma) available for each record within this time interval (Itzamna = ±73 years; Hulu = ±100 years; Perú = ±50 years; Paraíso = ±84 years). Vertical color bars illustrate the transition from humid to drier conditions as suggested by these speleothem δ18O records reflecting precipitation amount.

Similar articles

Cited by

References

    1. Dansgaard, W. et al. North Atlantic climatic oscillations revealed by deep Greenland ice cores. Vol. 29, 3–8 (American Geophysical Union, 1984).
    1. Oeschger, H. et al. Late glacial climate history from ice cores. Vol. 29 299–306 (American Geophysical Union, 1984).
    1. Hendy Il, kennett JP. Dansgaard-Oeschger cycles and the California Current System: Planktonic foraminiferal response to rapid climate change in Santa Barbara Basin. Paleoceanography. 2000;15:30–42. doi: 10.1029/1999PA000413. - DOI
    1. Wang YJ, et al. A high-resolution absolute-dated Late Pleistocene monsoon record from Hulu Cave, China. Science. 2001;294:2345–2348. doi: 10.1126/science.1064618. - DOI - PubMed
    1. Peterson LC, Haug GH, Hughen KA, Röhl U. Rapid Changes in the Hydrologic Cycle of the Tropical Atlantic During the Last Glacial. Science. 2000;290:1947–1951. doi: 10.1126/science.290.5498.1947. - DOI - PubMed

Publication types

LinkOut - more resources